
Exporting data from your Hyfi portal
This page walks you through Advanced Data Export — pulling stage, rainfall, climate, model-ready files, and photos out of the Hyfi portal across many sites and long date ranges. Exports are built in the background and delivered by email.

Table of Contents
- Access Requirements
- What You Can Export
- Size Limits and Delivery
- Creating an Export
- Video Guide
- What's Inside the ZIP
- Reading the QC Column
- Time Step, Gaps, and Estimation
- Timezones and Daylight Saving
- Ice-Obstructed Readings
- Photo Exports
- Troubleshooting
- Need Help?
Access Requirements
To use Advanced Data Export, you need ADMIN access on your team. If you or someone on your team needs access, please contact your Hyfi representative or email support@hyfi.io.
Exports are always emailed to the address you are signed in with. You cannot send an export to someone else's address — forward the download link instead.
What You Can Export
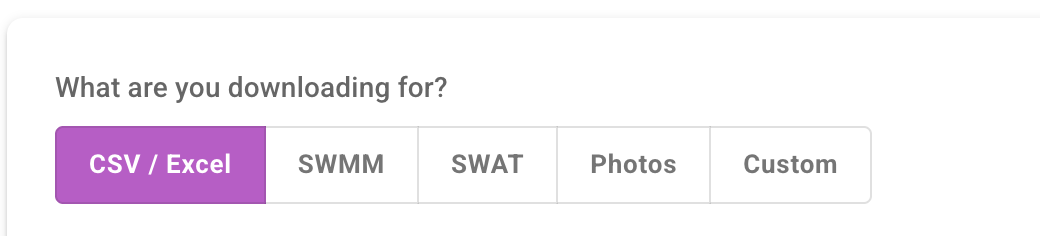
Start by telling the page what the data is for. Each option sets sensible defaults for everything below it, and you can still change any individual setting afterwards.
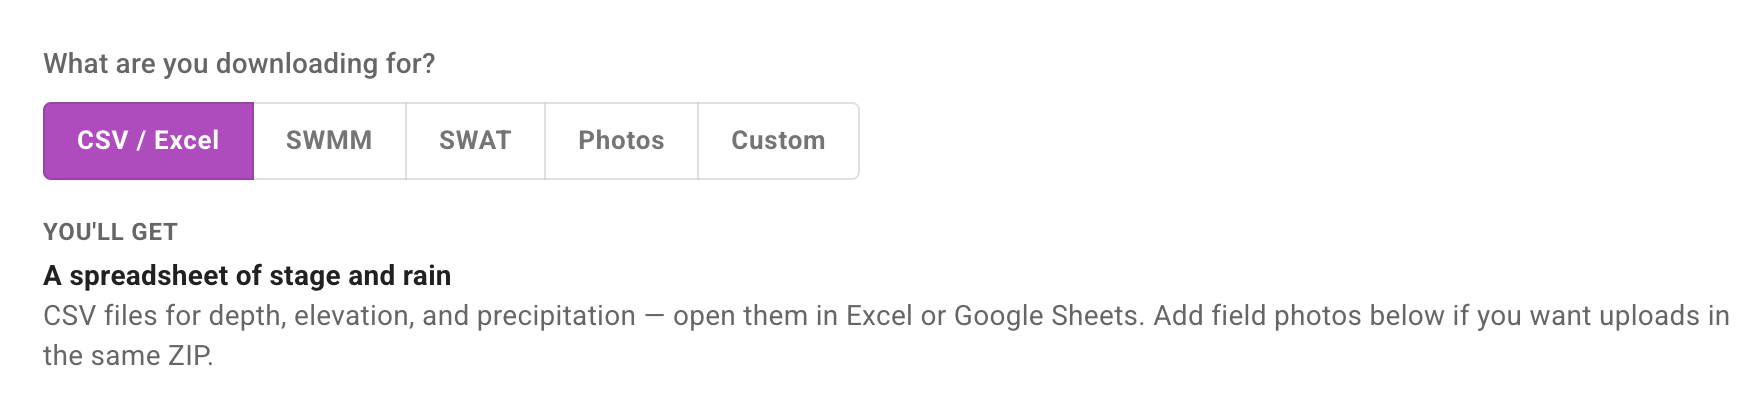
Depth, elevation, and precipitation as spreadsheets you can open in Excel or Google Sheets.
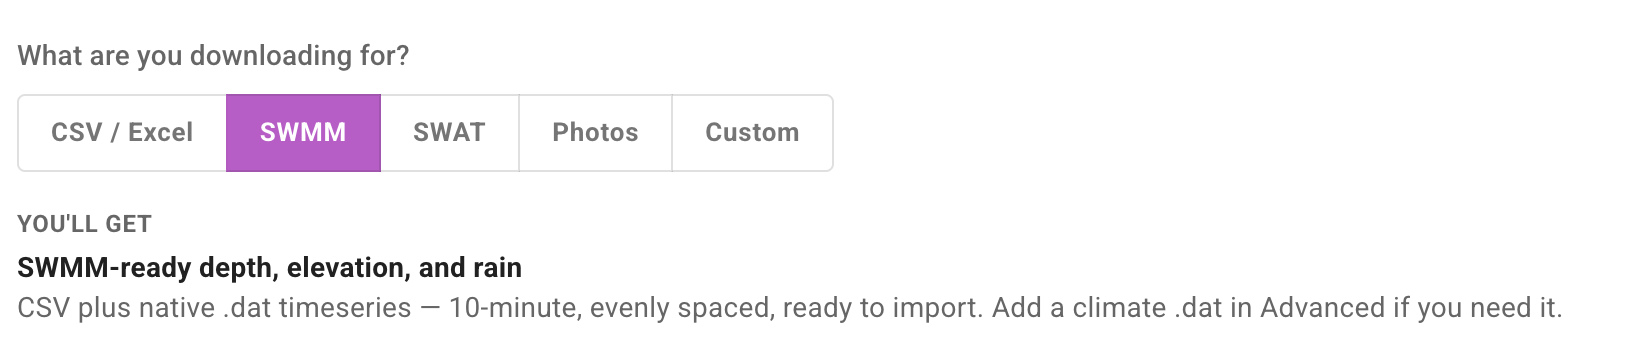
Native .dat timeseries on an even 10-minute step, ready to import, plus an optional climate file.
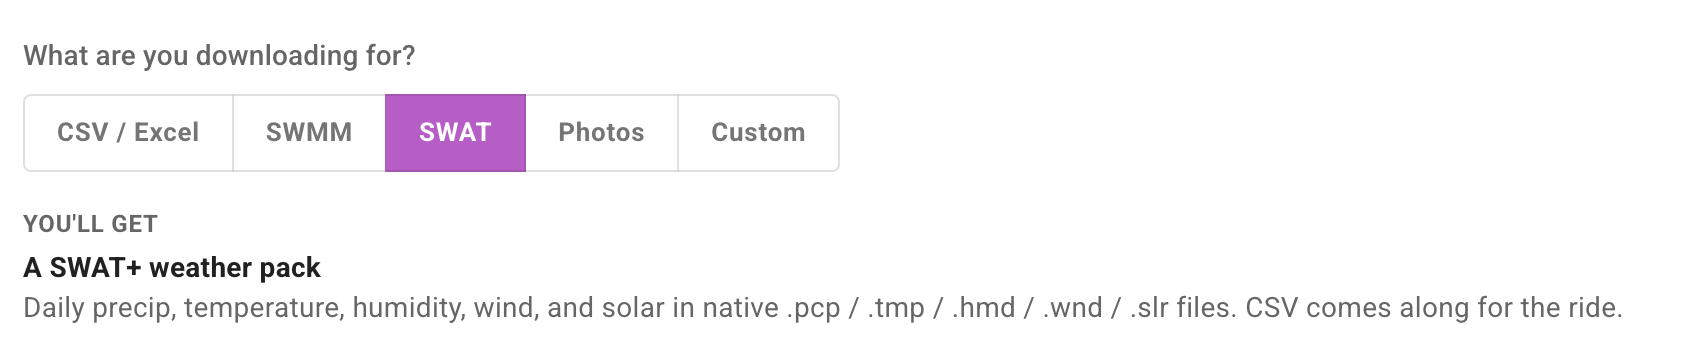
A daily weather pack in native .pcp, .tmp, .hmd, .wnd, and .slr files.
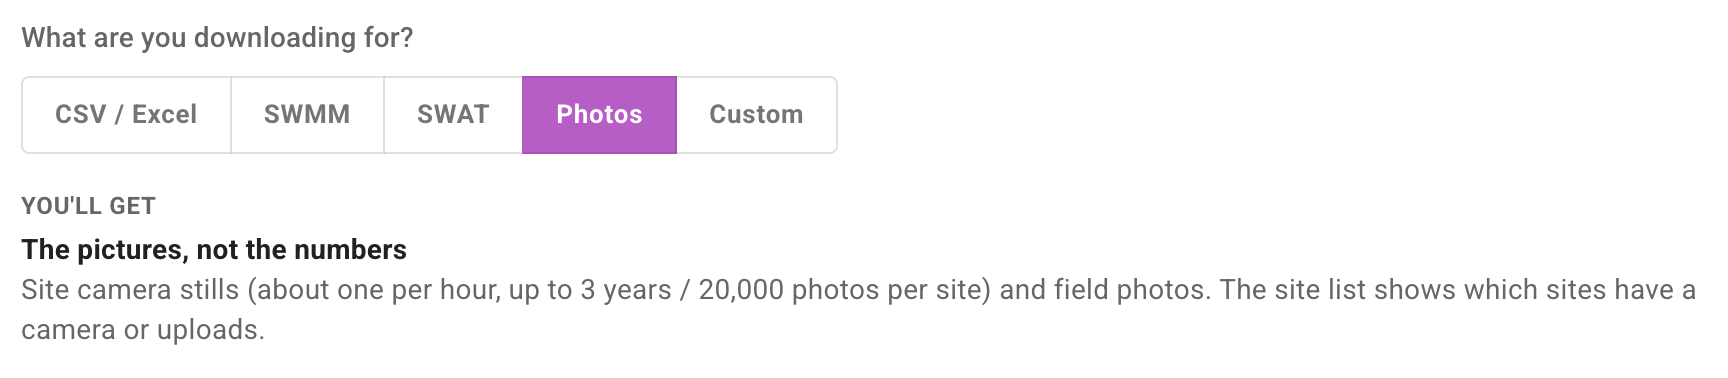
Site camera stills and field photo uploads, without the numbers.
A fifth option, Custom, starts from a spreadsheet and lets you add model files, climate parameters, or photos with individual checkboxes.
Size Limits and Delivery
| Sites per export | Up to 50 |
|---|---|
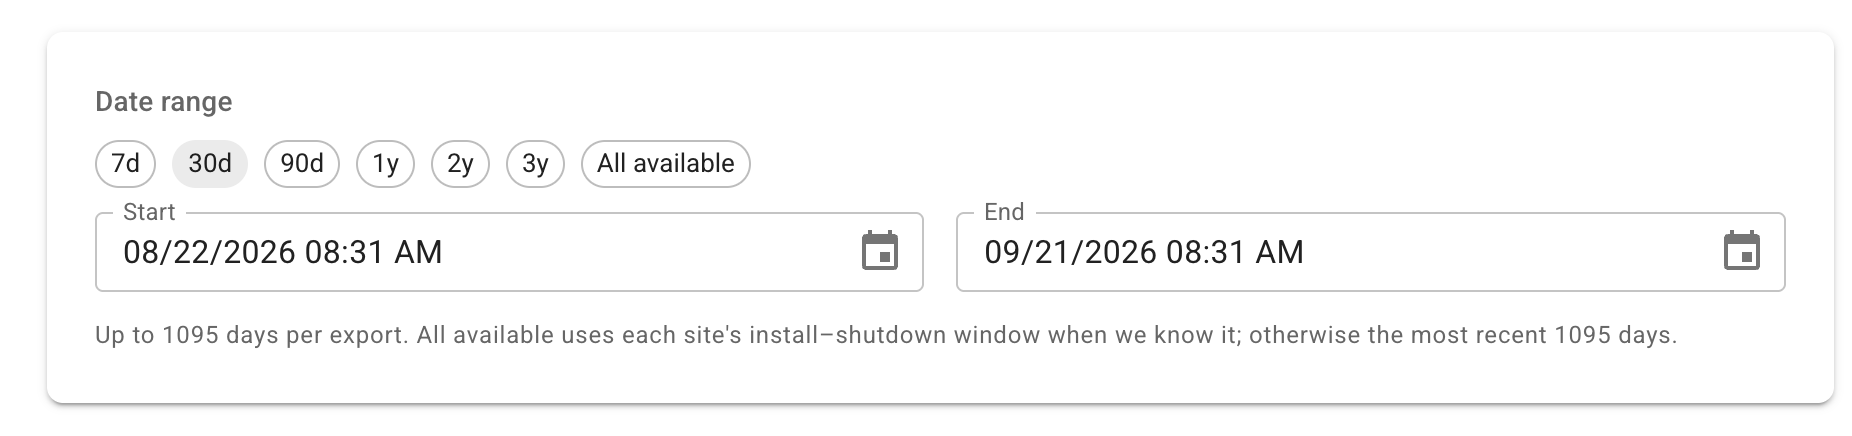
| Date range | Up to 3 years |
| Camera stills | About one per hour, up to 20,000 per site |
| Field photos | Up to 300 per site |
| Download link | Stays live for 14 days |
Large exports take a few minutes to build. You do not need to keep the page open — close the tab and wait for the email.
Creating an Export
- Click the download icon in the top navigation bar.

- Choose what you're downloading for. The panel underneath tells you exactly what you'll get.
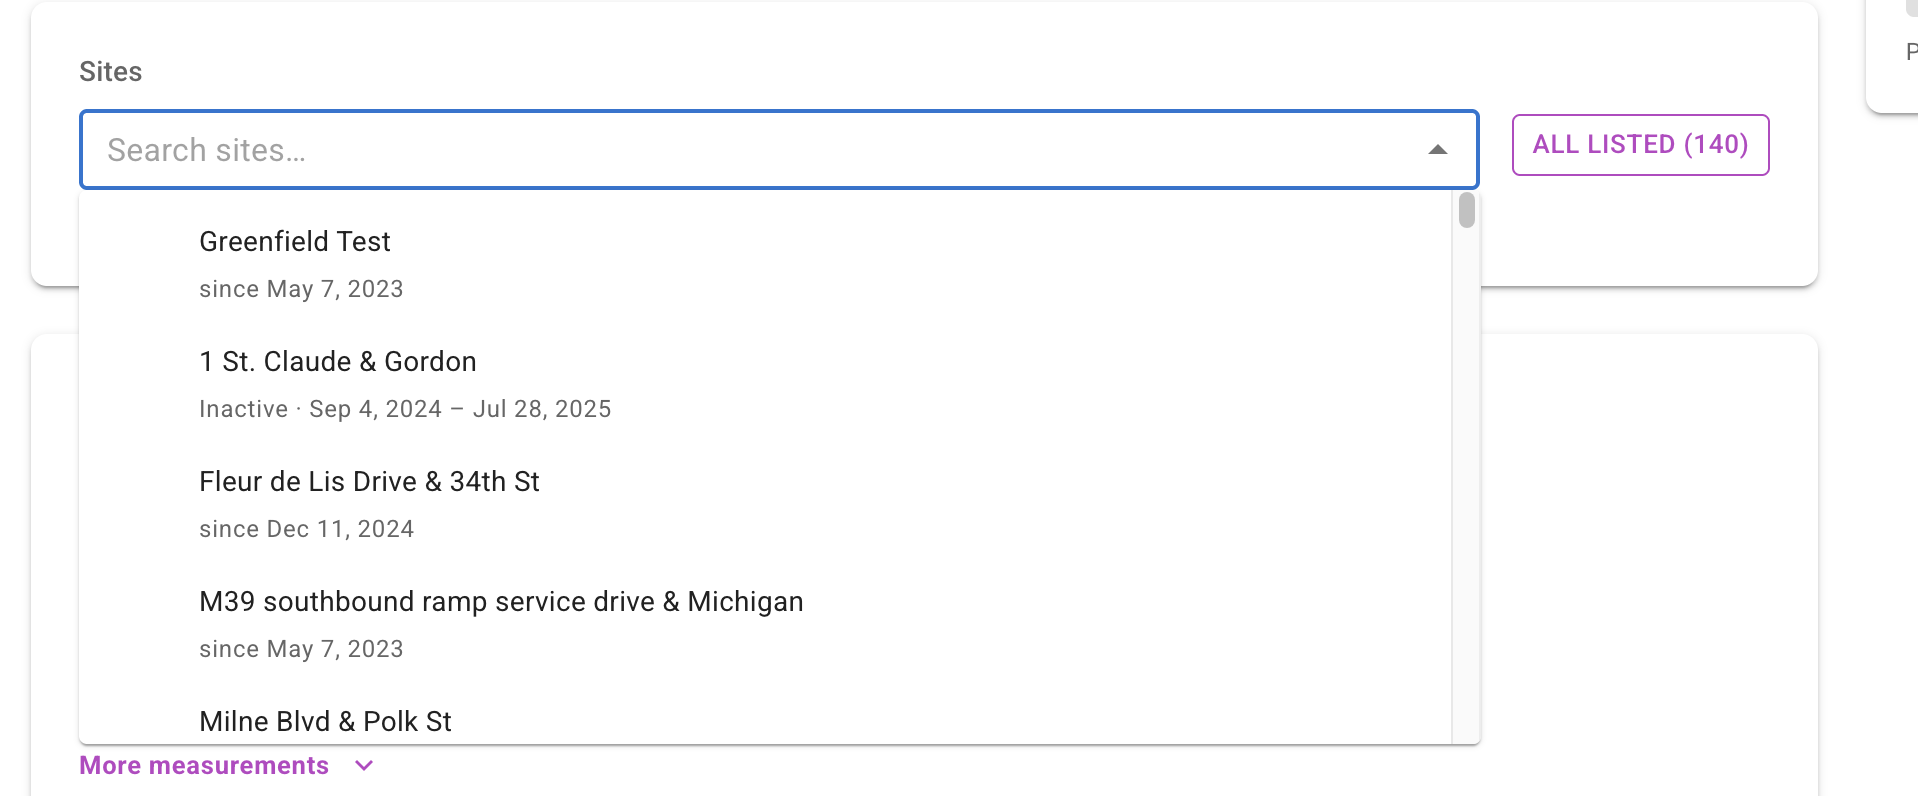
- Select your sites. Search by name or code, or use Select all. The list flags sites that have a camera or field photos.
- Set your date range with a preset or with custom start and end times.
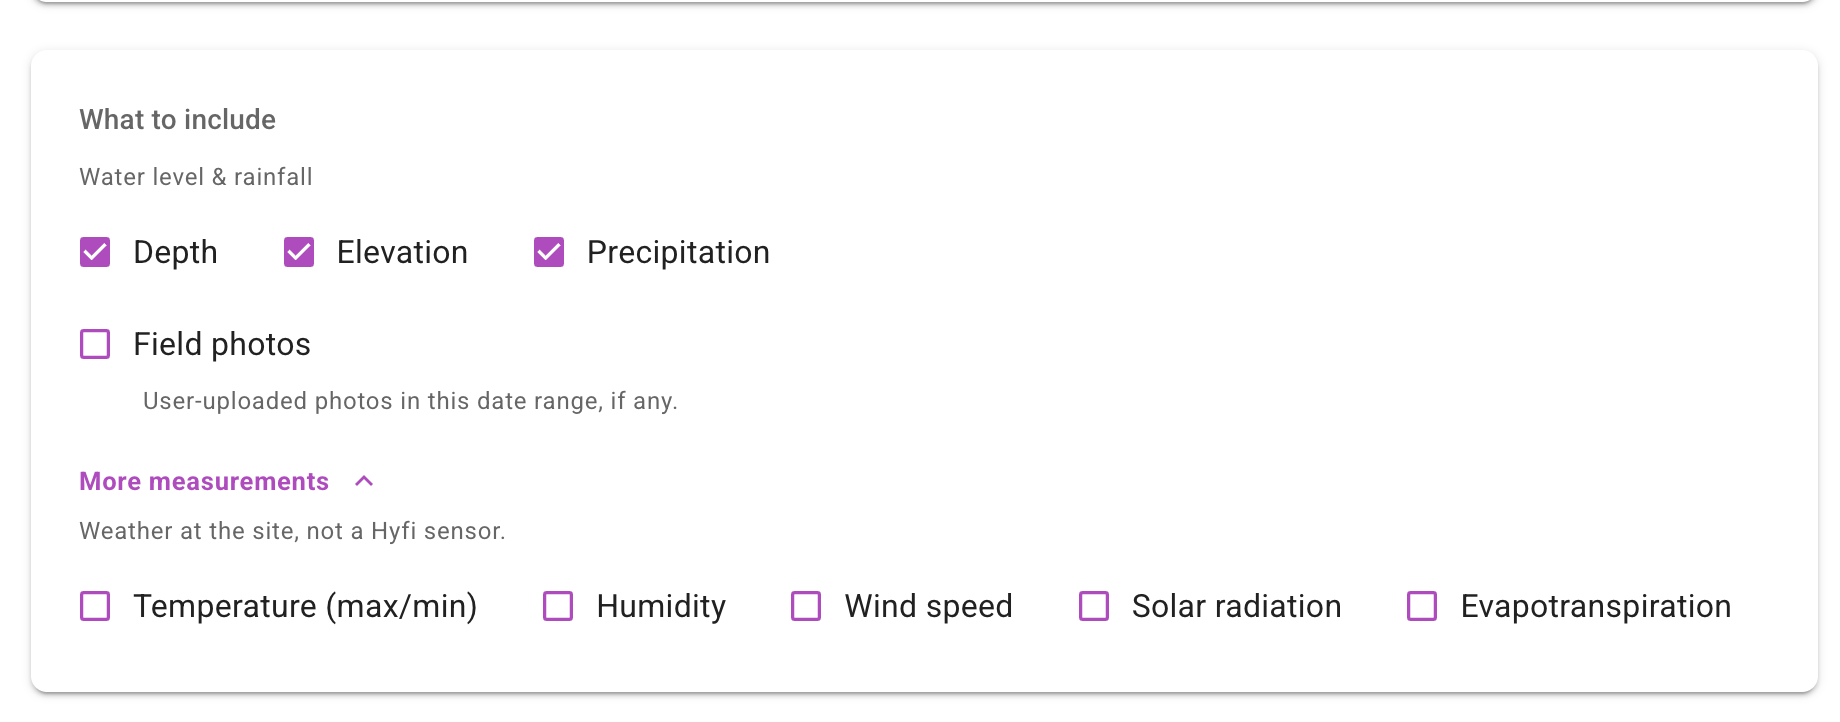
- Pick which measurements you want. Depth, elevation, and precipitation are on by default; More measurements opens temperature, humidity, wind, solar radiation, and evapotranspiration.
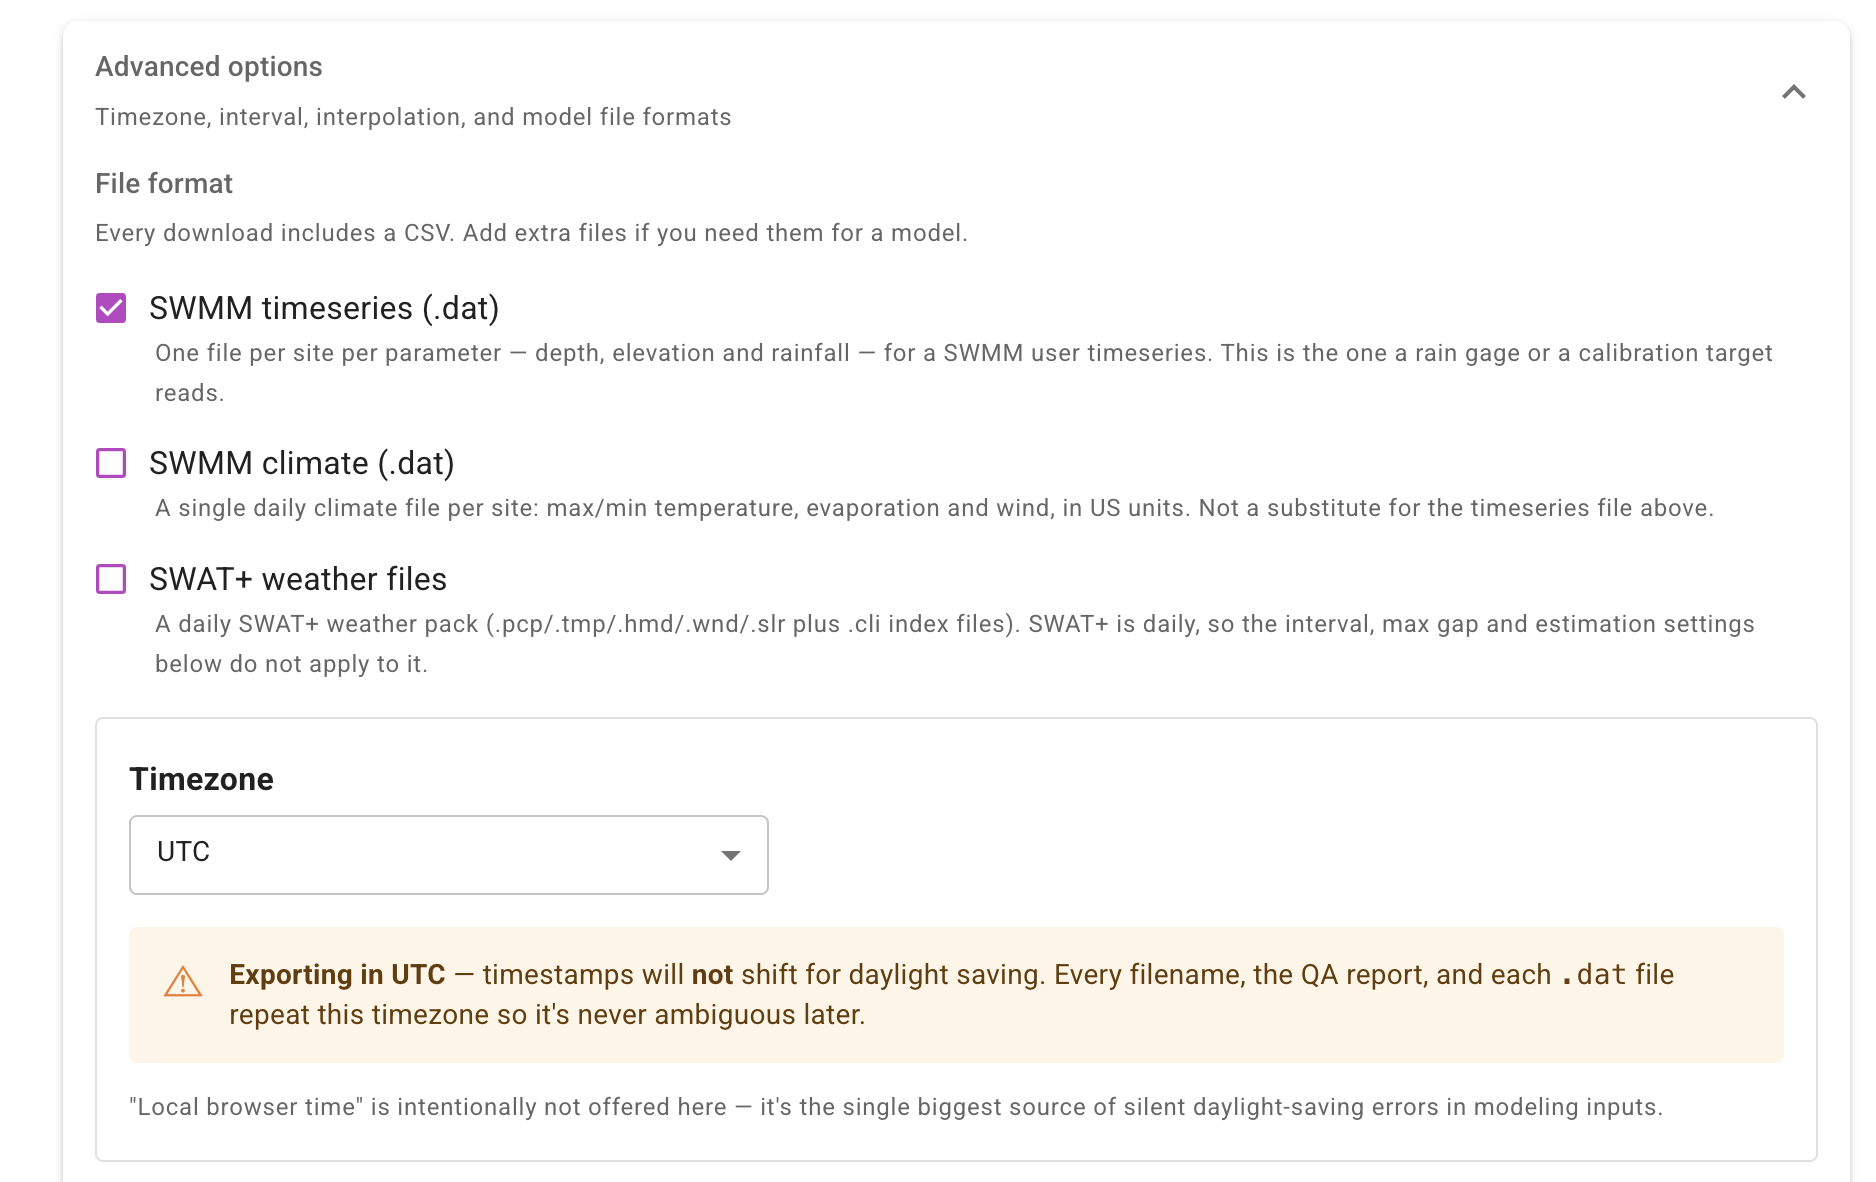
- Optional. Open Advanced options to change the time step, timezone, gap handling, or estimation method. Most people never need to.
- Check the summary on the right. It lists every file you're about to receive and every setting that produced them.

- Click Request export. You'll see a confirmation, and the email arrives when the files are built.
What's Inside the ZIP
Every export arrives as a single ZIP. Depending on what you asked for, it contains:
csv/— one file per site and measurement, named with the site code, the parameter, and the timezoneswmm/—.dattimeseries and climate files, if you selected SWMMswat/—.pcp,.tmp,.hmd,.wnd, and.slrfiles, if you selected SWAT+photos/— camera stills and field uploads, organized by siteqa_report.json— a machine-readable summary of coverage: expected and actual point counts, percent estimated, percent missing, and the largest gap for every site and parameter
Each CSV also opens with a header block recording the site, coordinates, datum, agency, time range, timezone, units, time step, estimation method, and maximum gap. If you hand the file to a colleague or a reviewer, those settings travel with it.
Reading the QC Column
Every row in every CSV carries a qc column saying where that value came from. This is the fastest way to tell real readings from filled ones.
| Value | Meaning |
|---|---|
measured | A sensor or archive reading as recorded. |
interpolated | Synthesized while resampling onto the even time step. |
zero_filled | A rainfall slot with no record, treated as dry because you chose the zero-fill policy. |
reanalysis | A modeled climate value from ERA5 rather than a site sensor. |
ice_affected | Inside a marked ice-obstruction window, kept because this export did not exclude them. |
qa_report.json tells you how many.
Time Step, Gaps, and Estimation
Sensors do not all report at the same moment, so an export resamples every site onto one even time step. That is what lets the files line up in a model without a cleanup pass first.
- Output interval — every 5, 10, 15, or 30 minutes, or hourly.
- Estimation method — how a value between two readings is worked out: linear, nearest, or previous.
- Maximum gap — the longest stretch worth filling. Beyond it, the export leaves the period out rather than inventing a shape for it.
- Rainfall gaps — leave blank, or fill with zero. This is the difference between "we don't know" and "it didn't rain," and it changes a model's totals, so choose it deliberately.
SWAT+ files are daily, so the interval, maximum gap, and estimation settings do not apply to them.
Timezones and Daylight Saving
You can export in UTC, EST (UTC−5), or EDT (UTC−4).
Ice-Obstructed Readings
When a sensor is reading off the underside of an ice sheet, the water level it reports is not the water level. Hyfi marks those periods, and you decide what an export does with them:
- Remove them (the default) — those rows are left out of the file.
- Keep and flag them — the values stay, marked
ice_affectedin theqccolumn, so you can judge them yourself.
The qa_report.json records how many ice windows applied to each site and how many points each one affected.
Photo Exports
Photo exports come in two kinds, and you can include either or both:
- Camera stills — automatic site camera images, sampled at roughly one per hour.
- Field photos — images uploaded by people visiting the site.
The site list shows which sites have a camera and which have field uploads, so you can narrow the selection before you commit. Photo exports get large quickly — the page warns you before you request one that will take a while.
Troubleshooting
| What you're seeing | What to do |
|---|---|
| No download icon in the navigation bar | You do not have ADMIN access on this team. Contact your team administrator or support@hyfi.io. |
| "Access Restricted" when you open the page | Same cause as above — the export is limited to team administrators. |
| The email hasn't arrived | Large exports take several minutes. Check your spam folder. If it's been more than 20 minutes, write to support@hyfi.io with the time you requested it. |
| The download link no longer works | Links expire after 14 days. Request the export again. |
| A site you selected has no data in the file | The summary panel warns when a selected site has no data in your date range — usually because it was installed after the range ended or removed before it started. |
More rows are marked interpolated than you expected |
That reflects resampling onto the even time step, not missing data. Check pct_missing and largest_gap_minutes in qa_report.json for the real coverage picture. |
Need Help?
If you're having trouble exporting data, or you need an export larger than the limits on this page, contact your Hyfi representative or email support@hyfi.io.