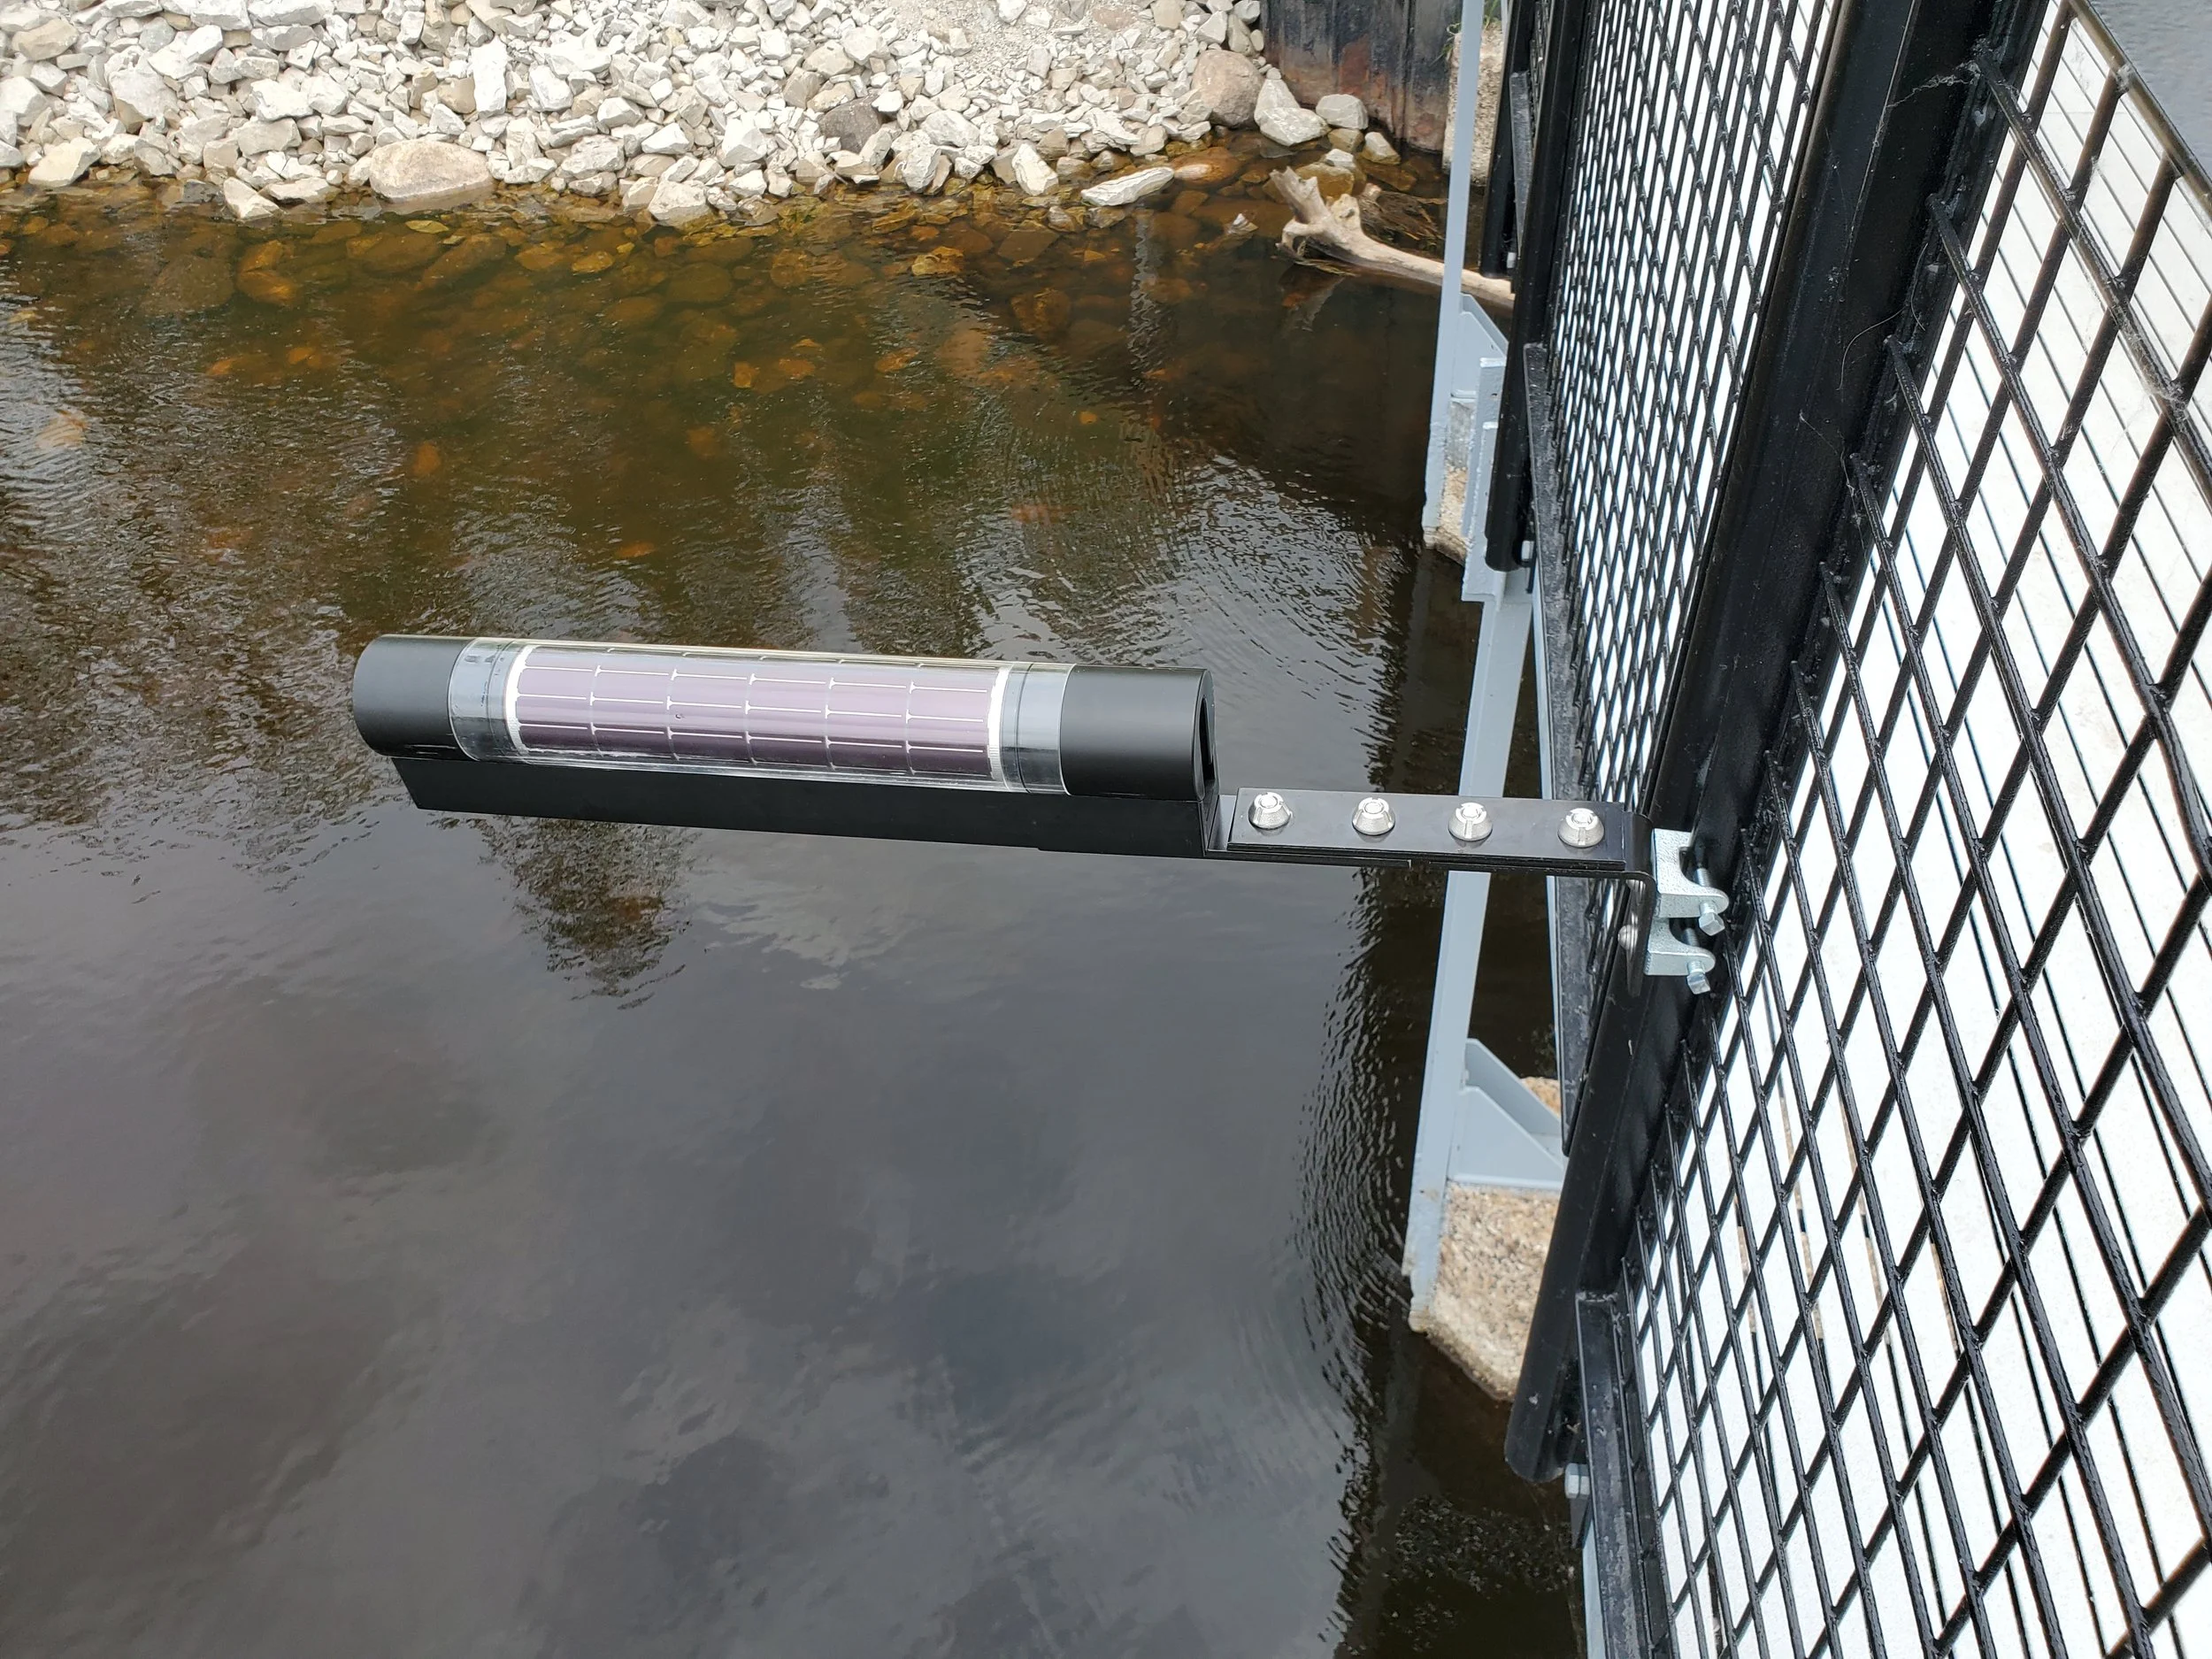
Wireless Water Level Monitors

No more wire wiggling
The easiest to maintain and most reliable water level monitors on the market. If it goes out, we will just mail you a new one — free shipping included. Swaps out in a minute.
-
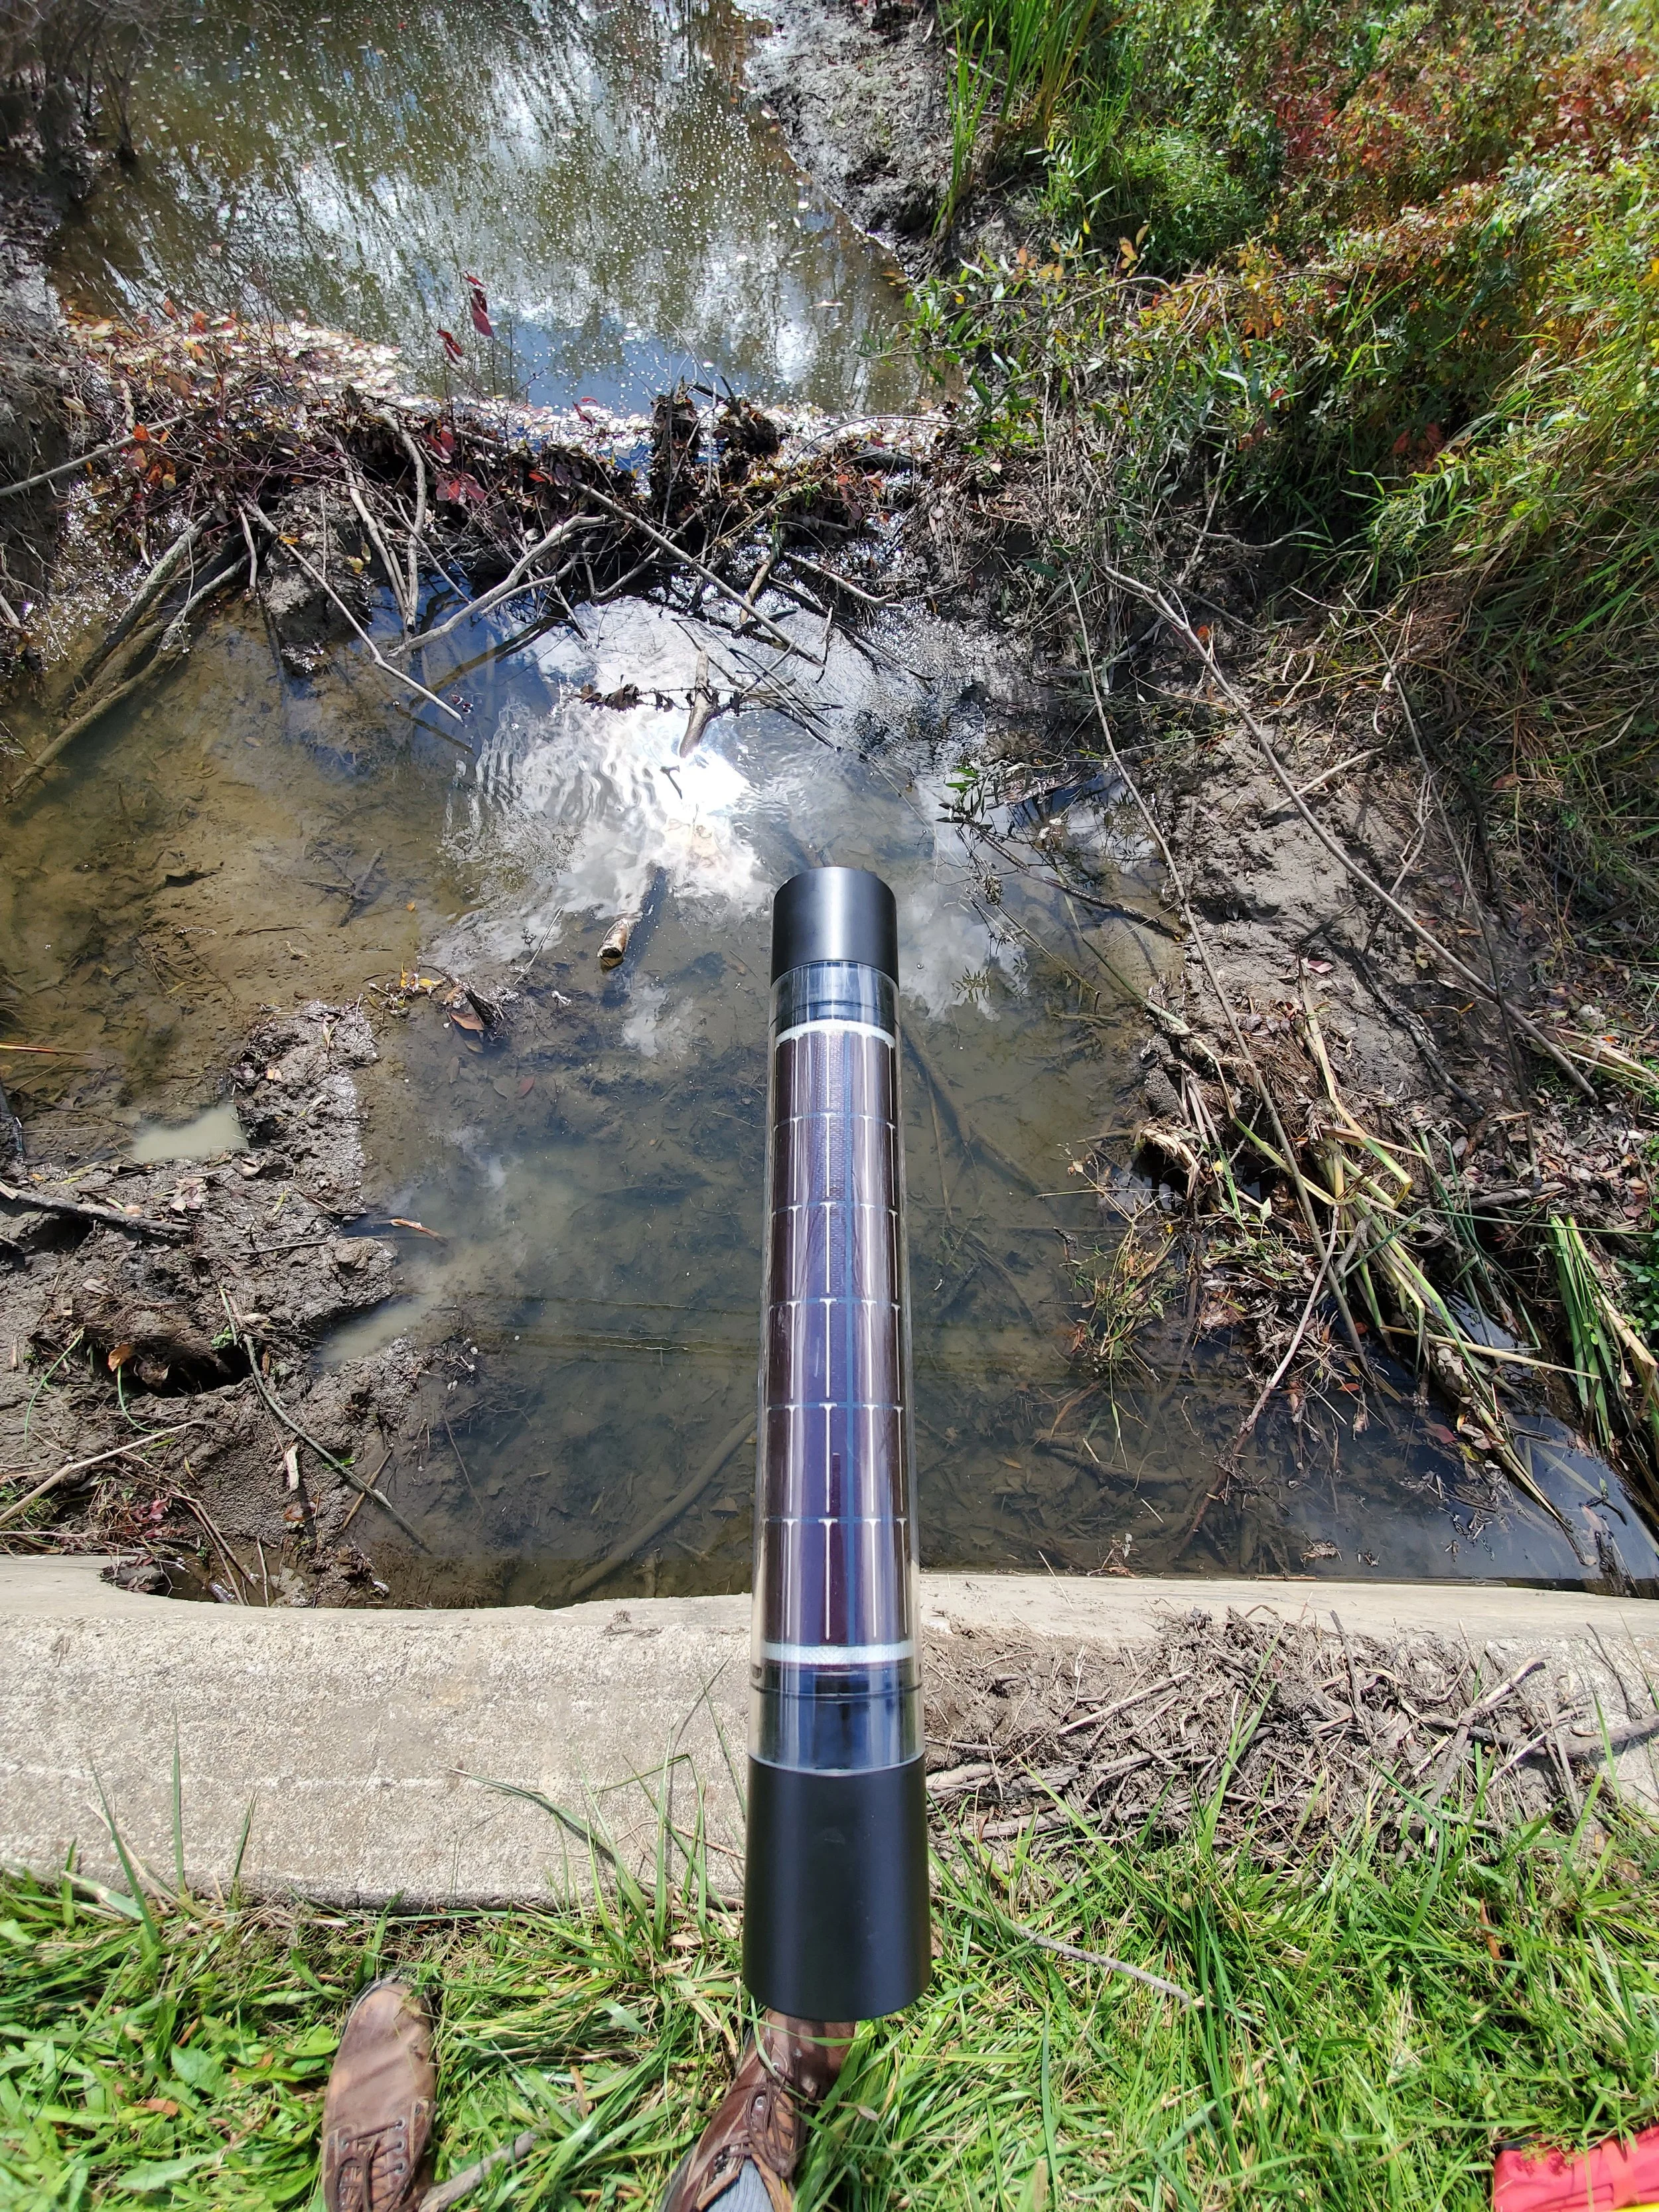
Built-in solar and battery power
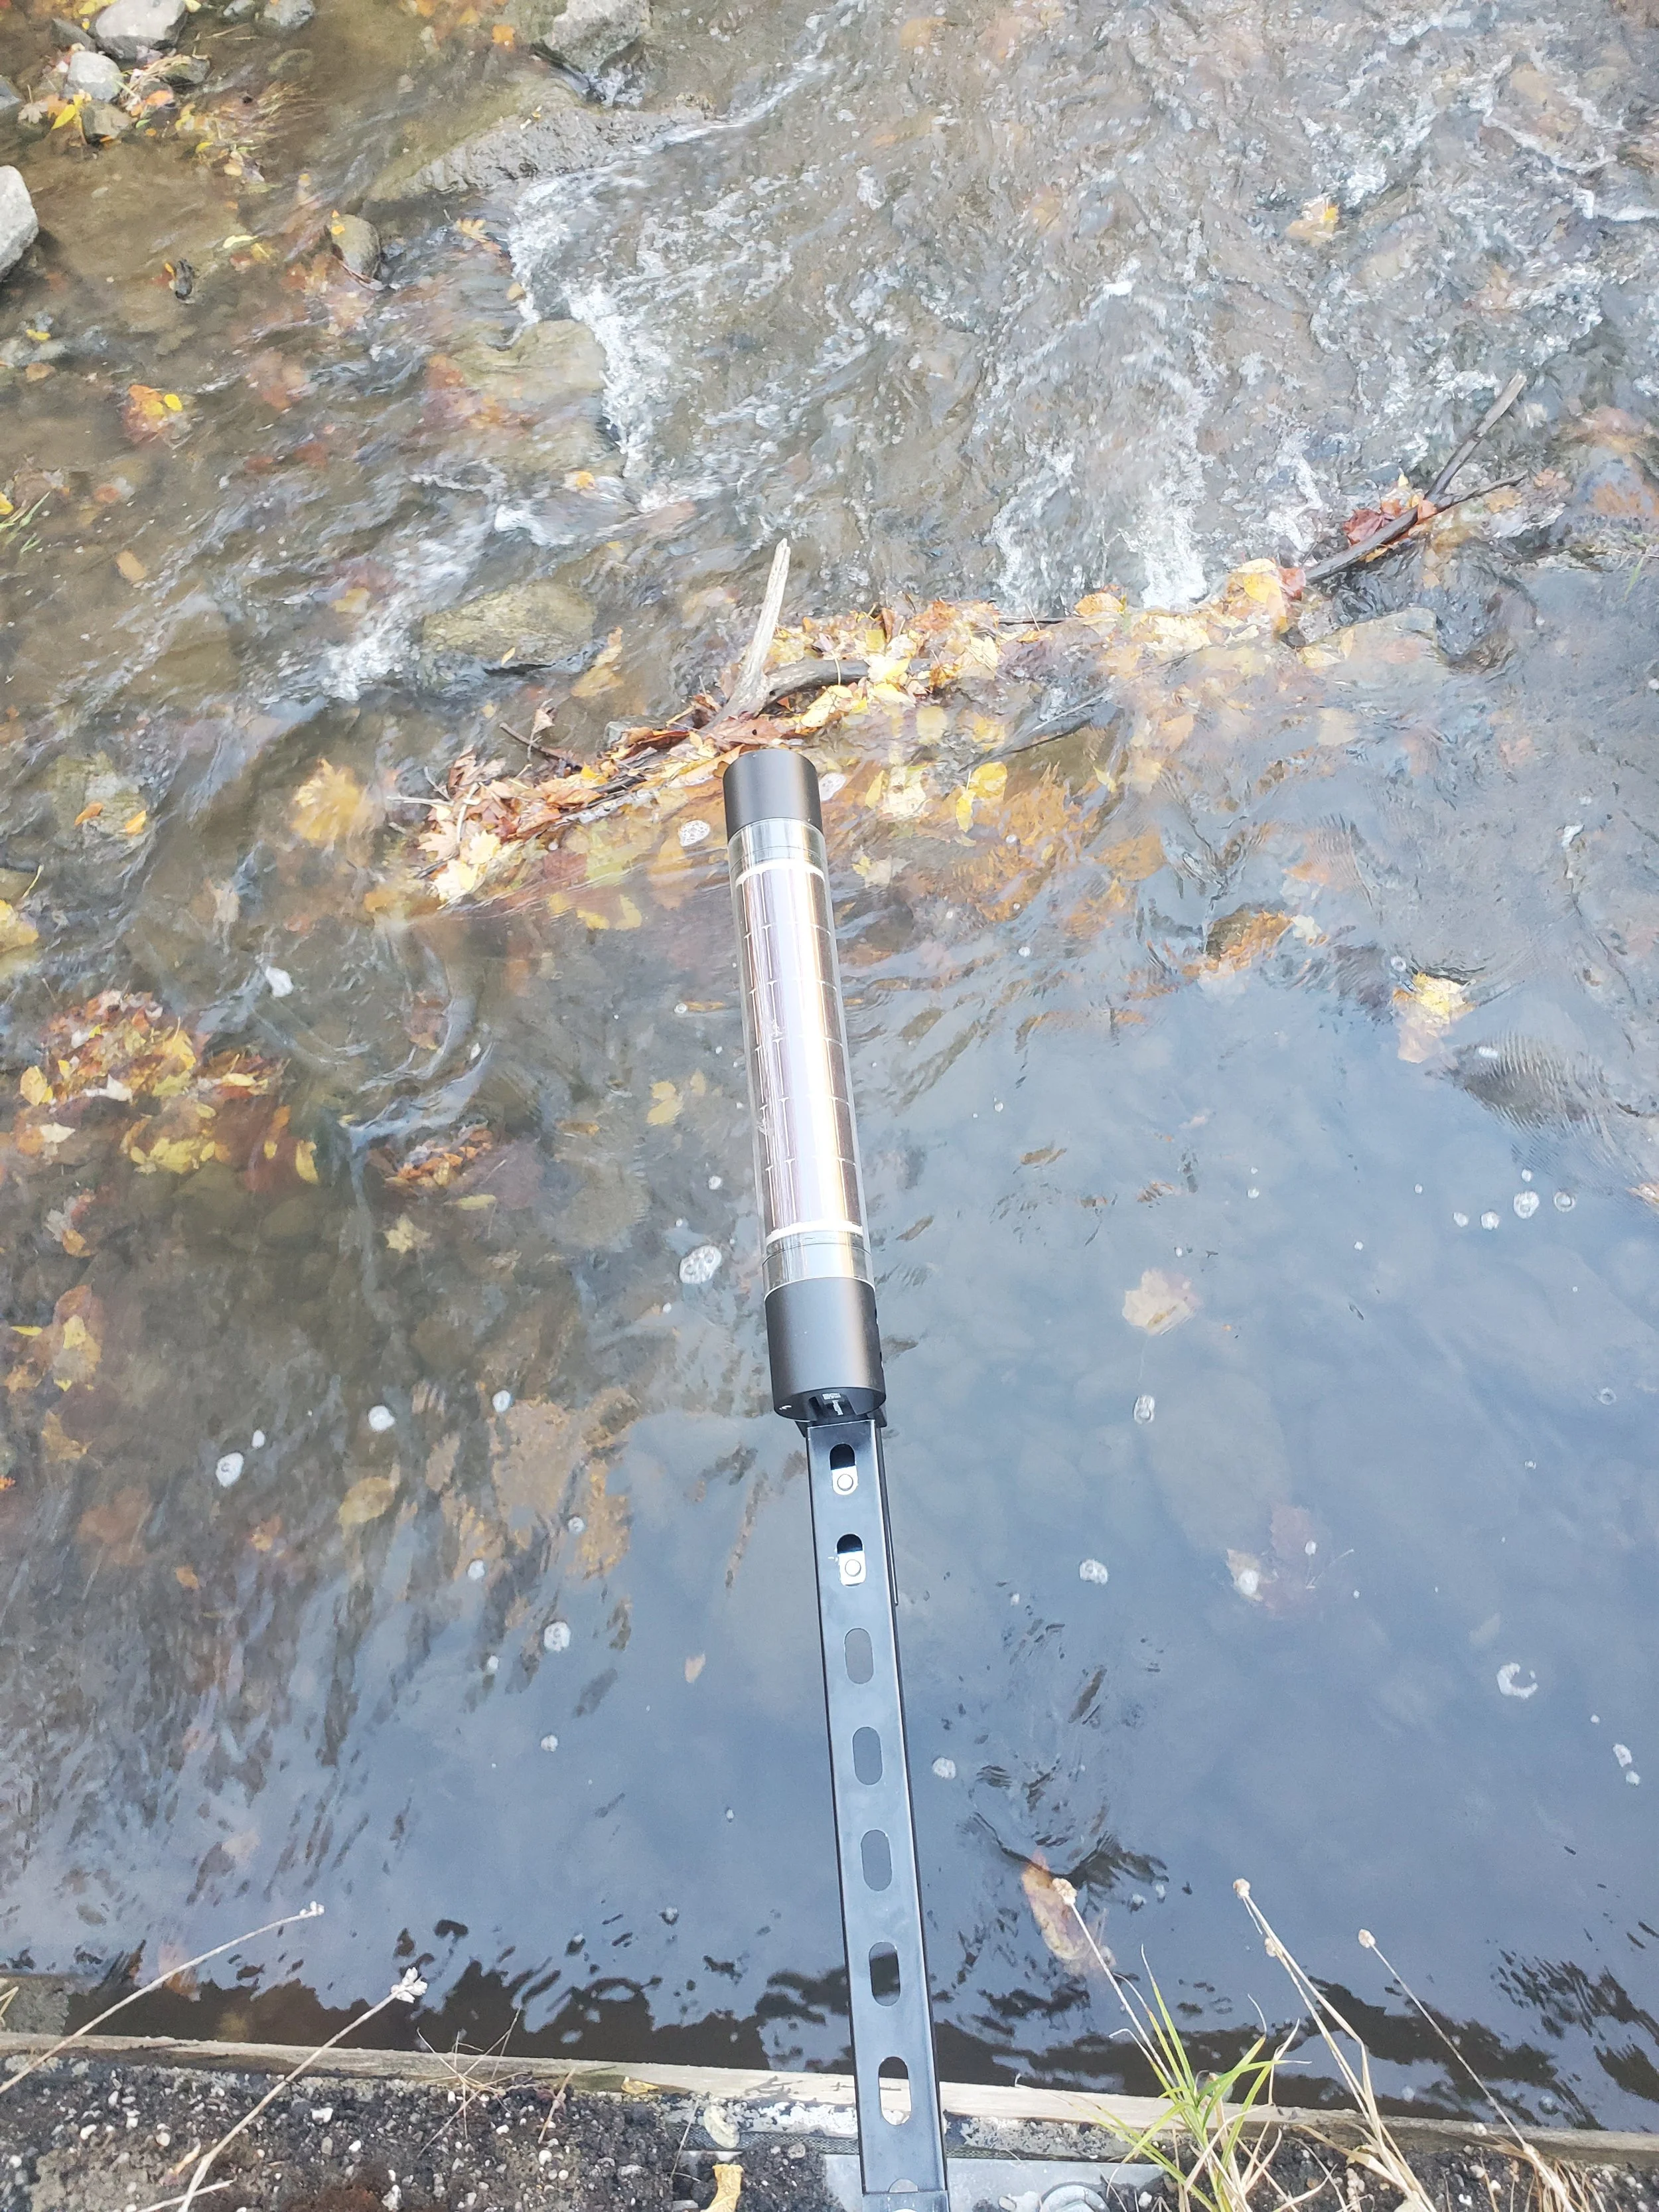
"Down looking" sensor measures water level to within an inch
Wireless connectivity via cell network
Measurements made at least every 10 minutes
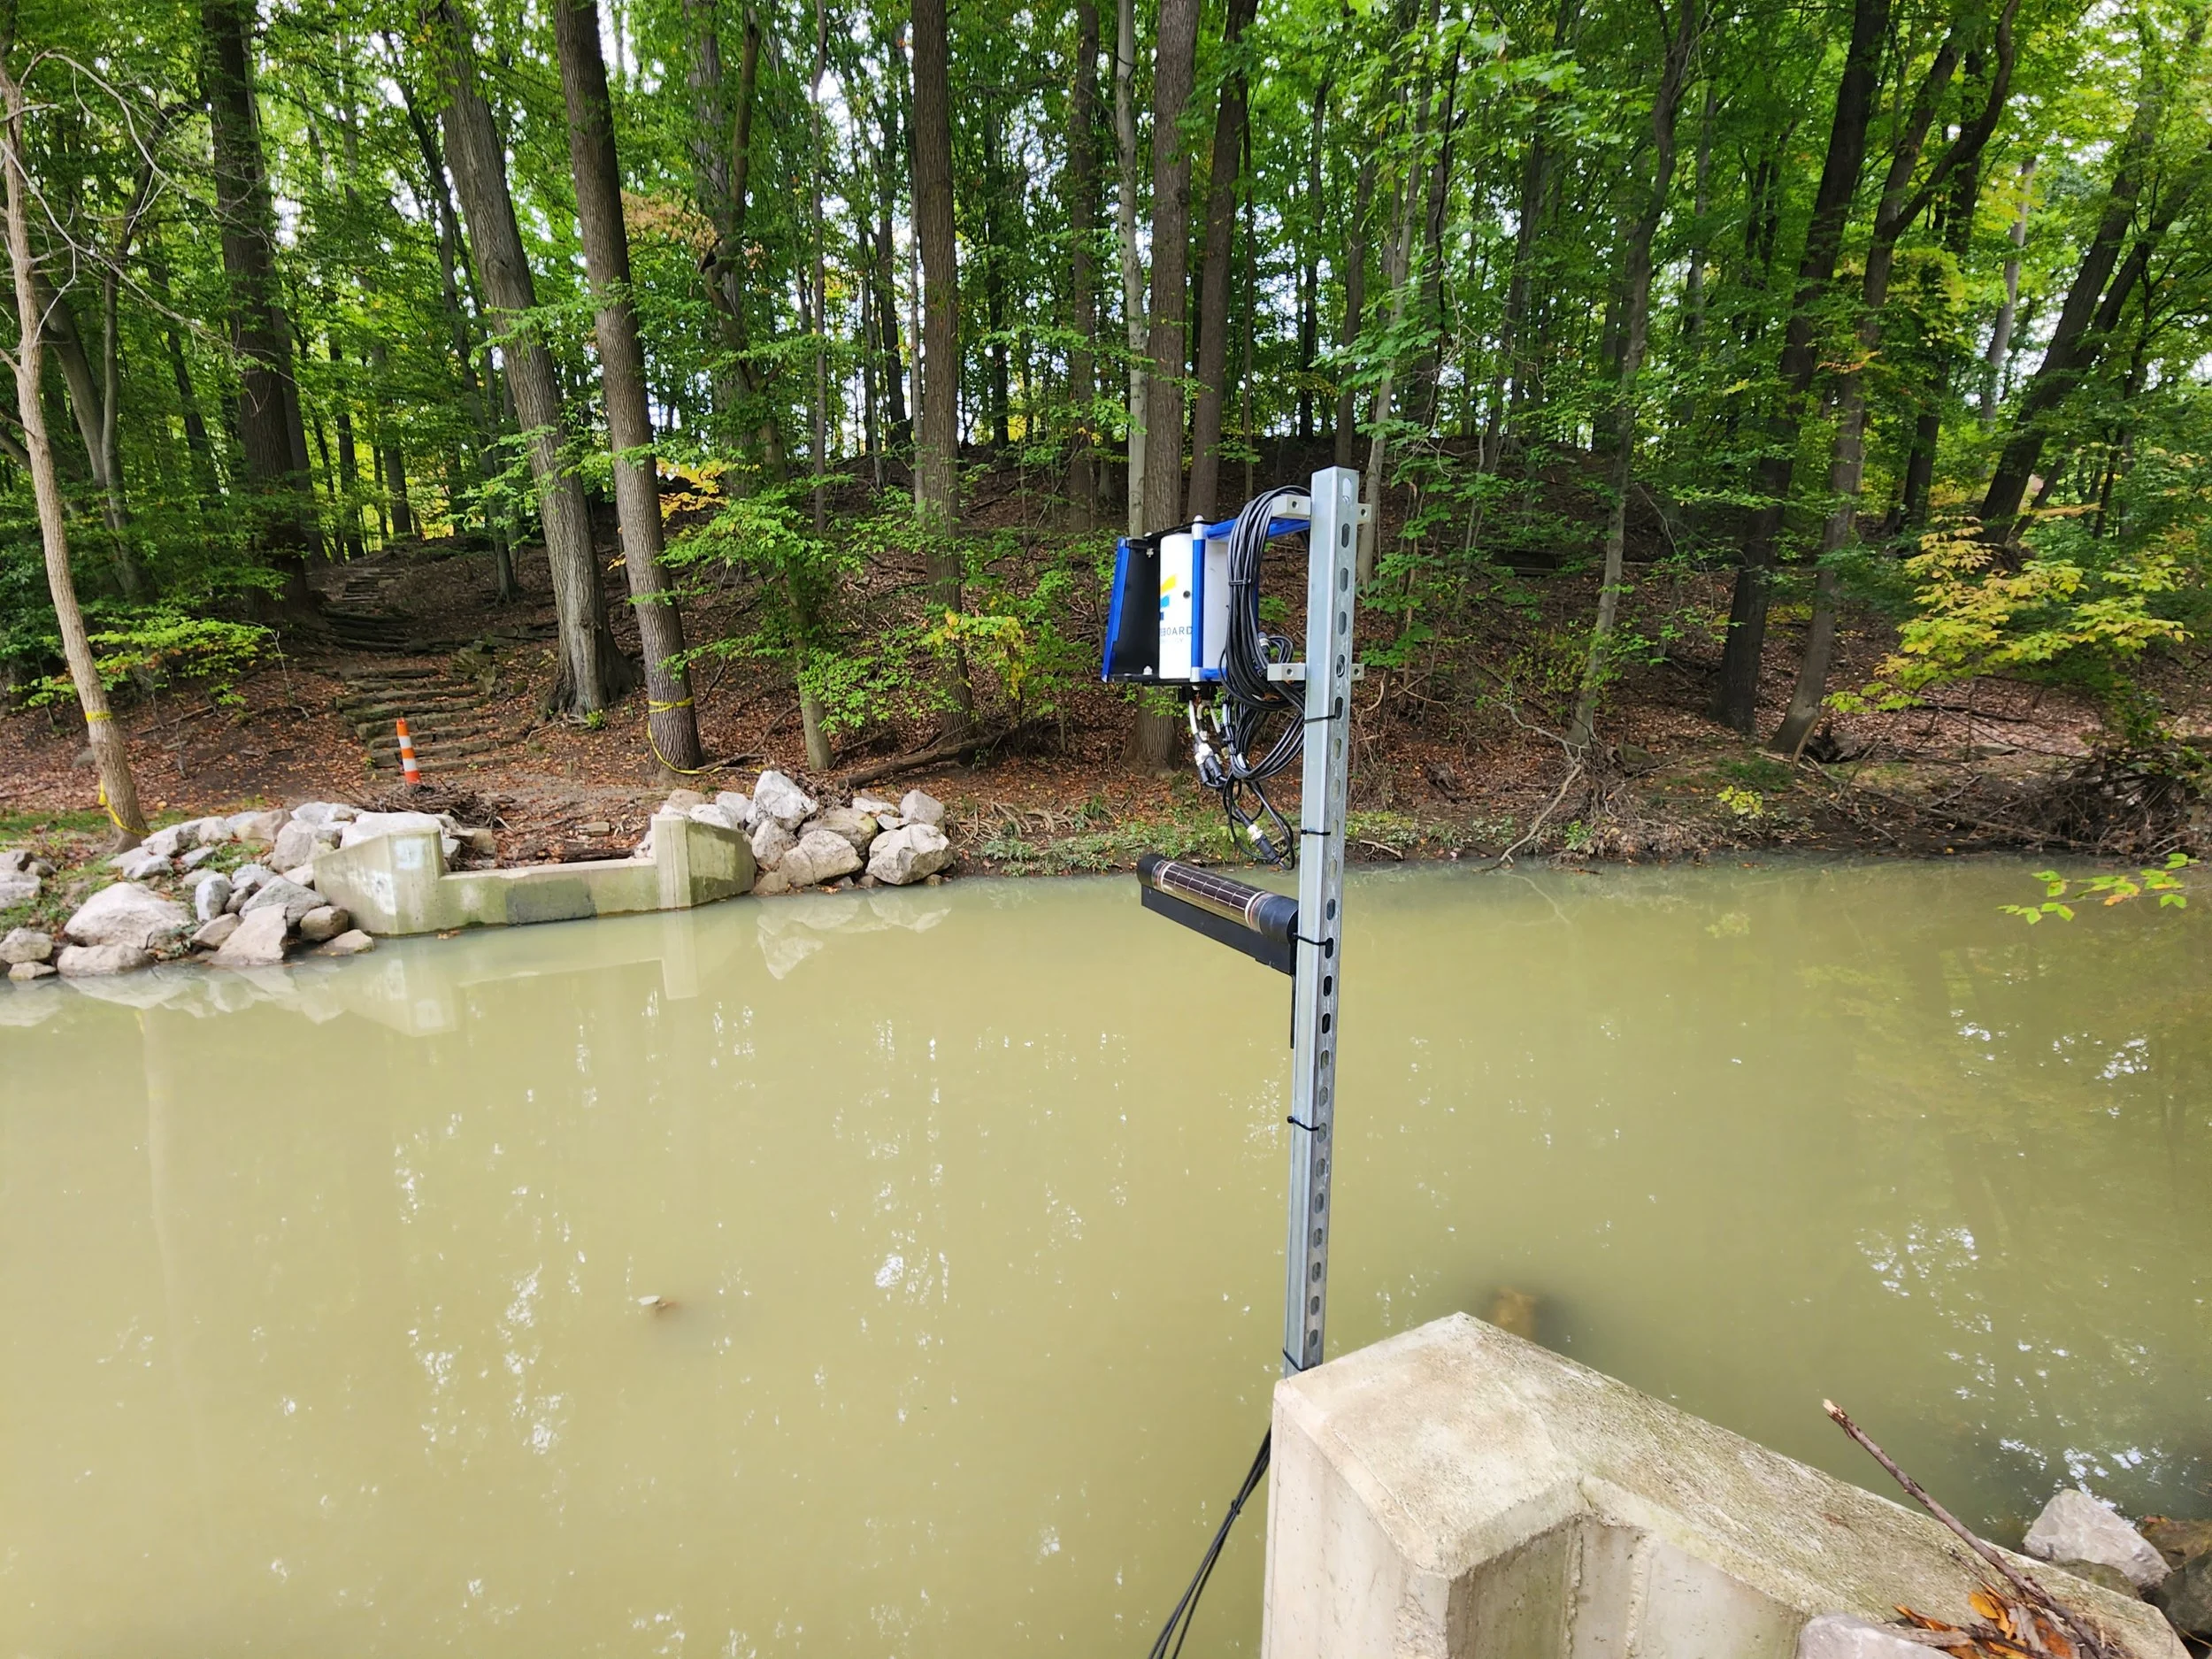
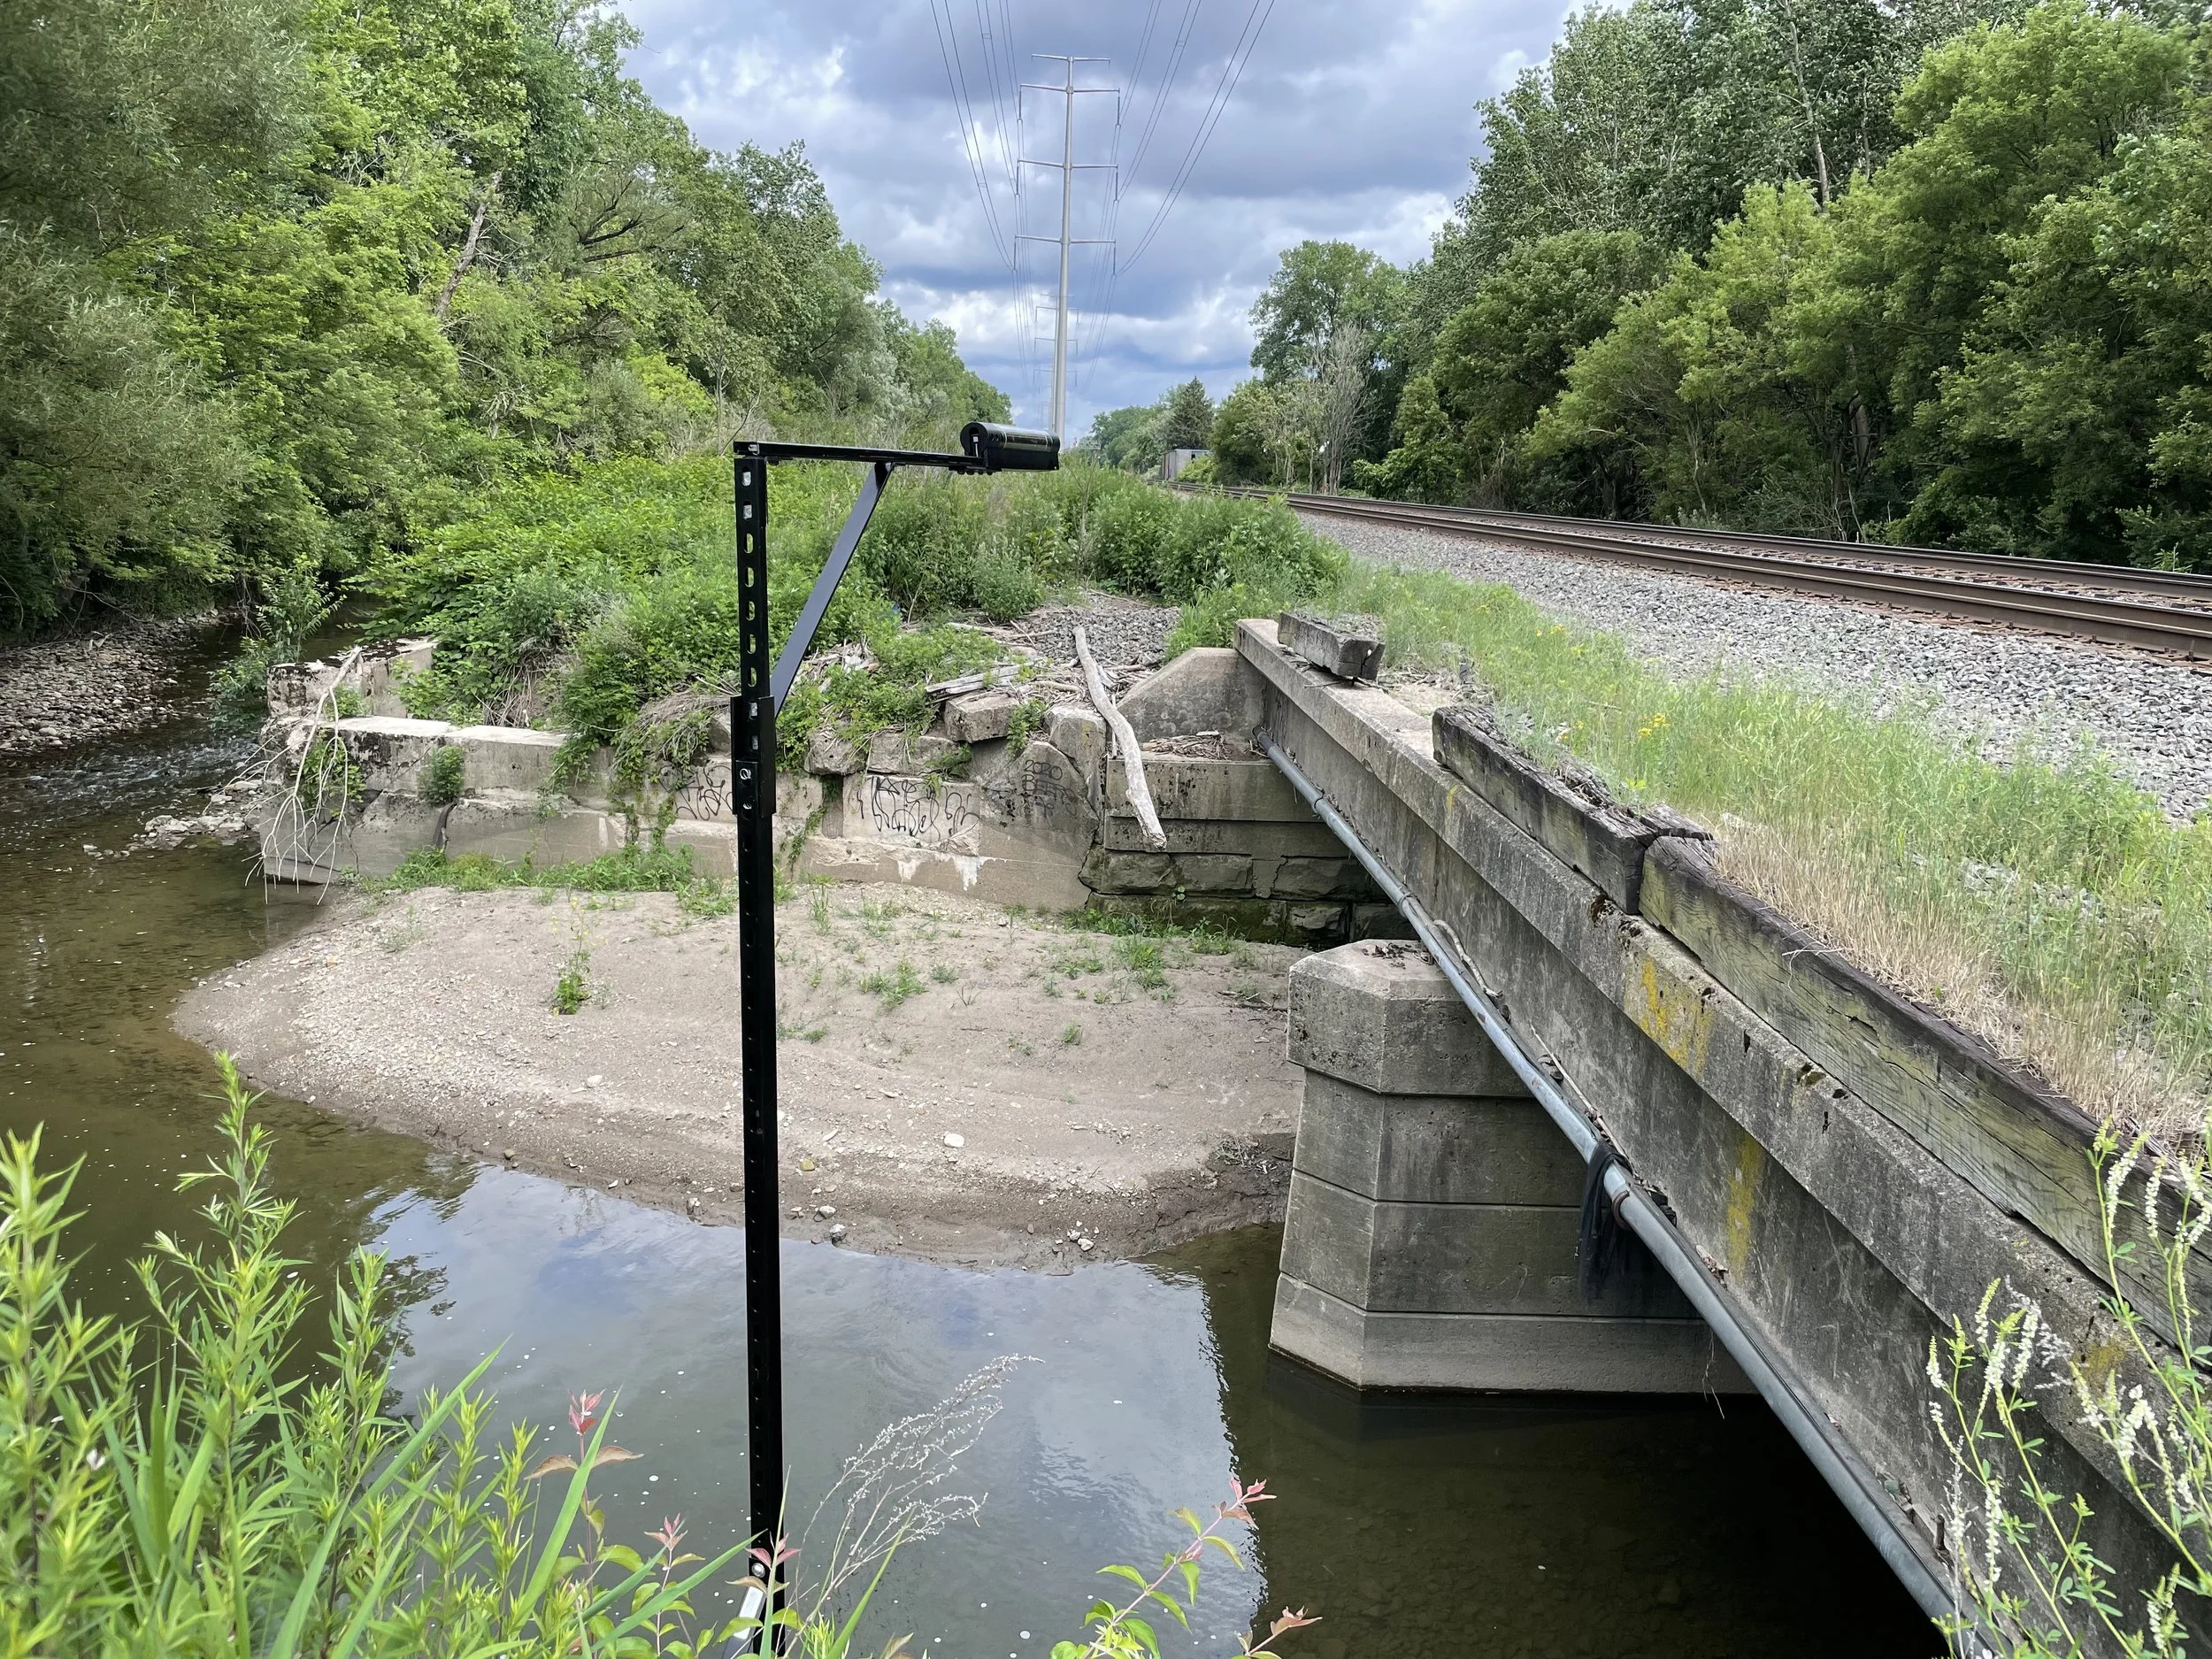
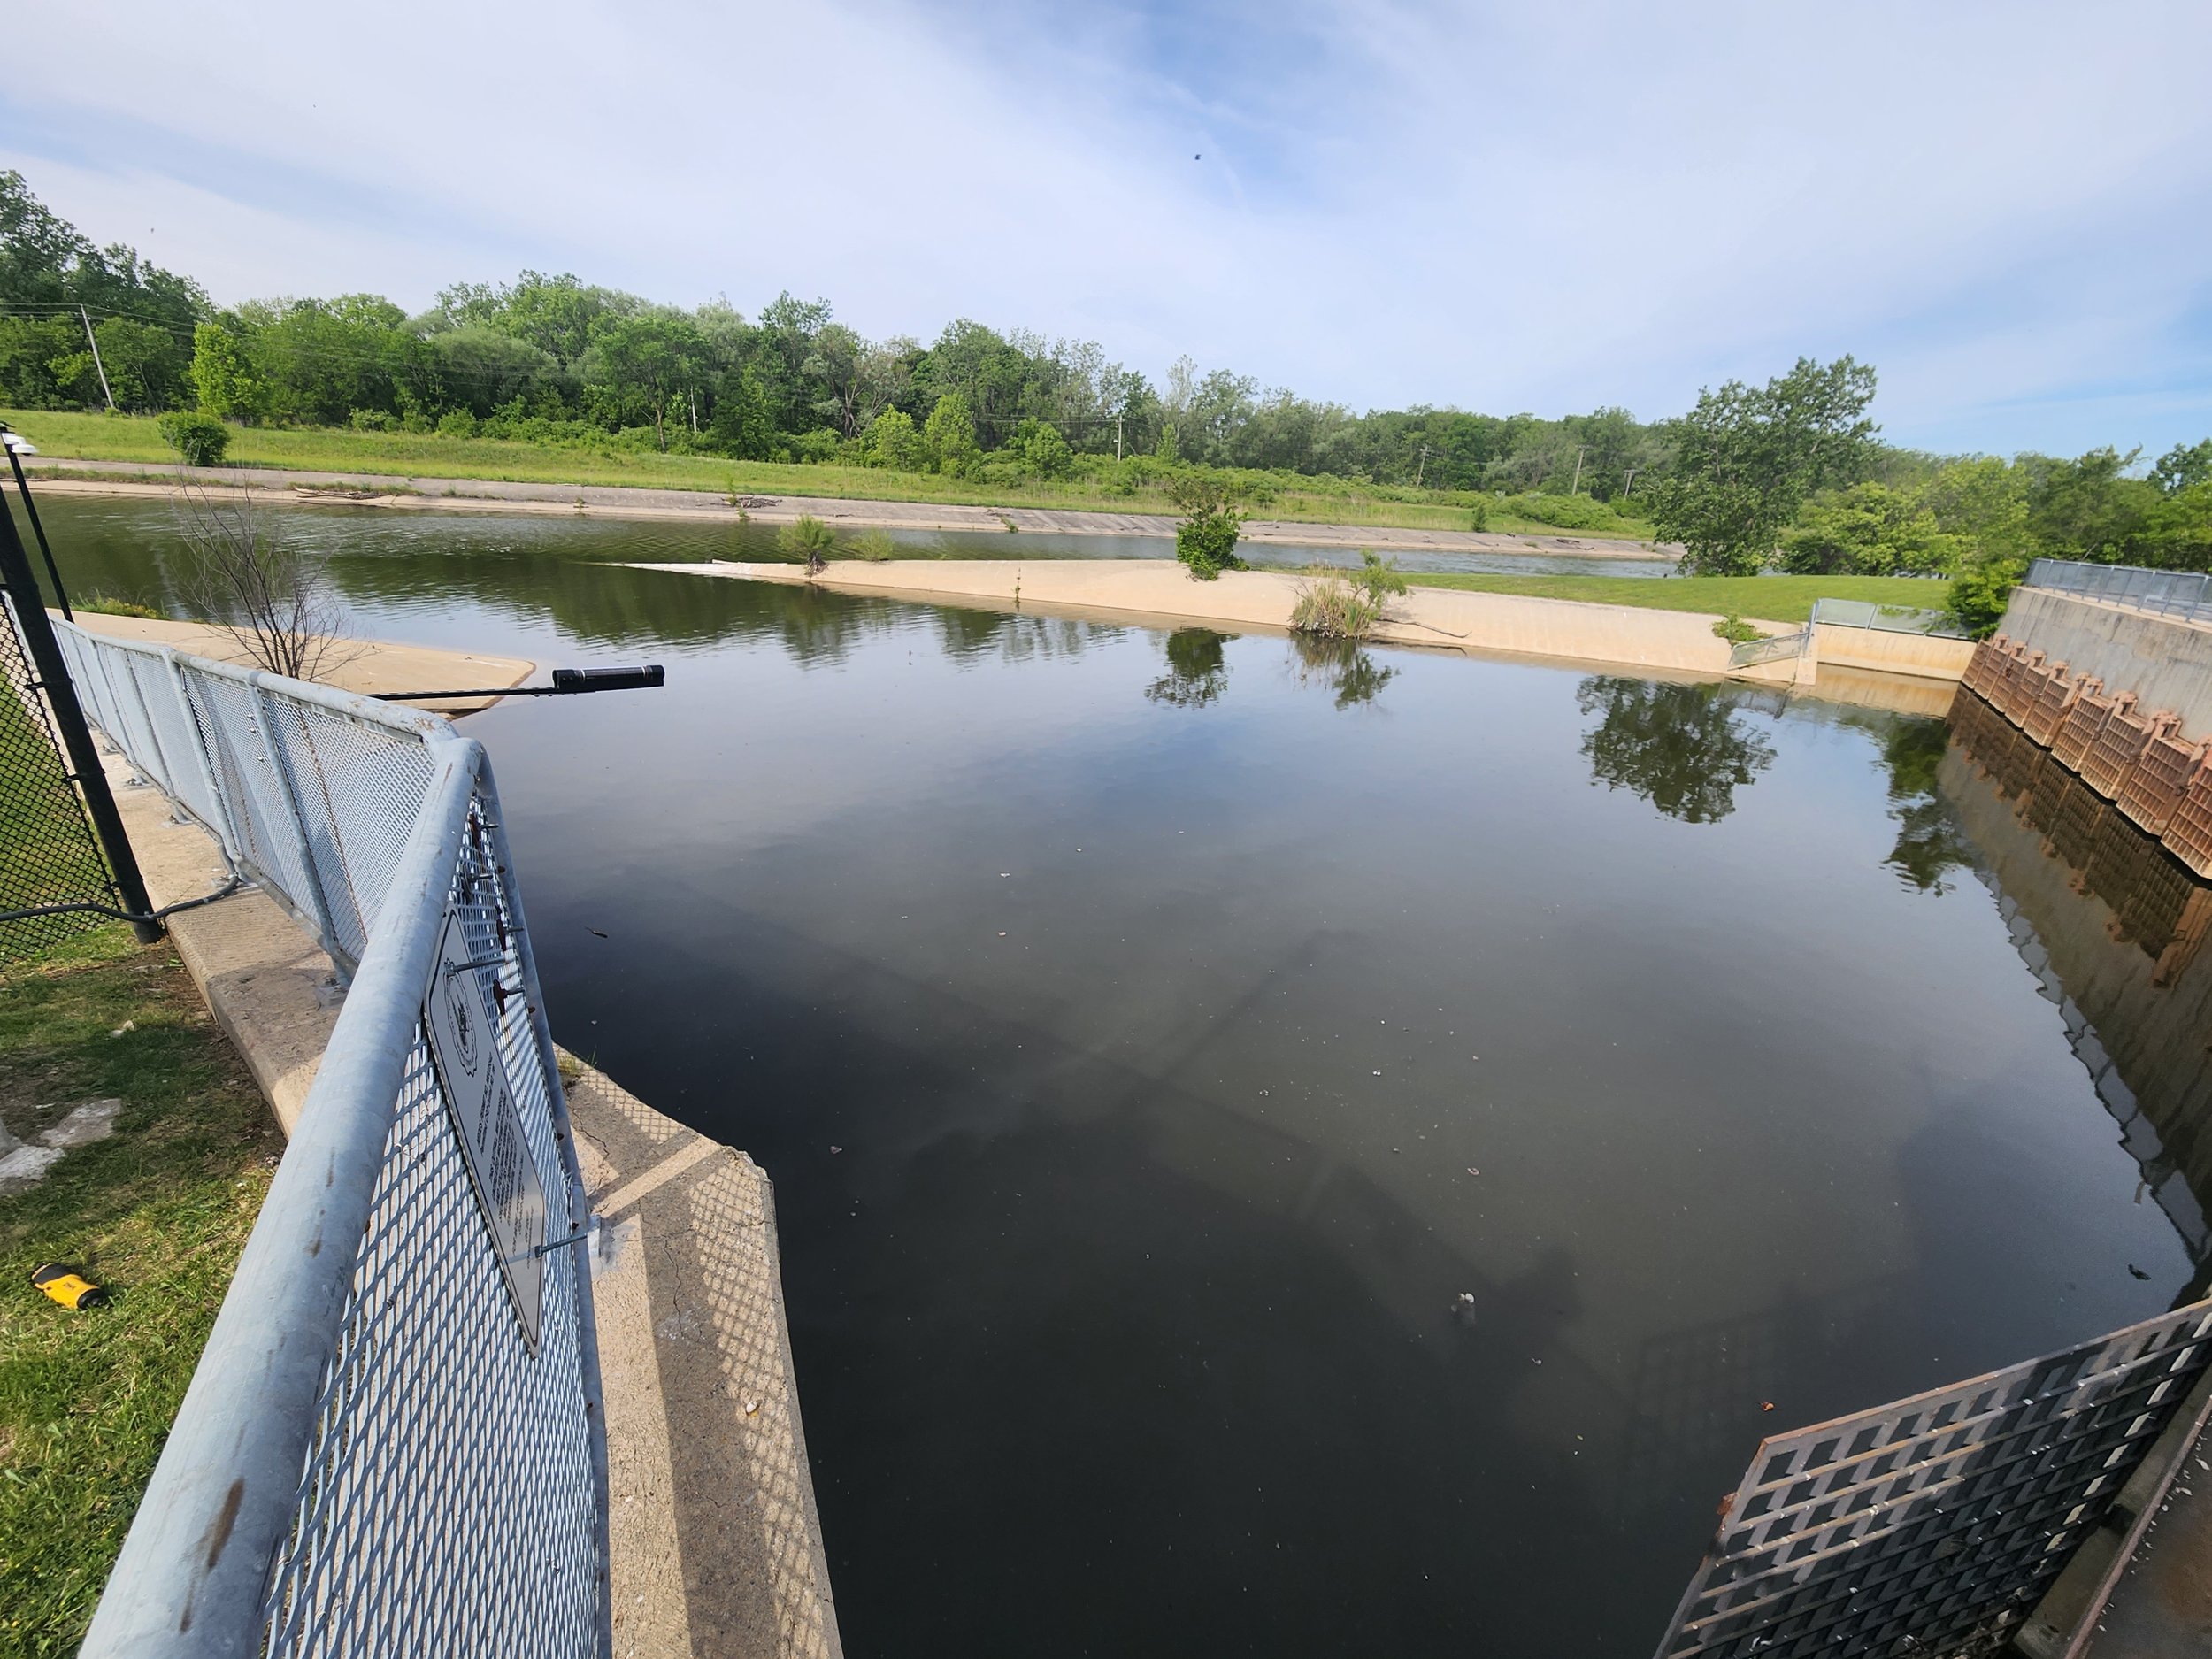
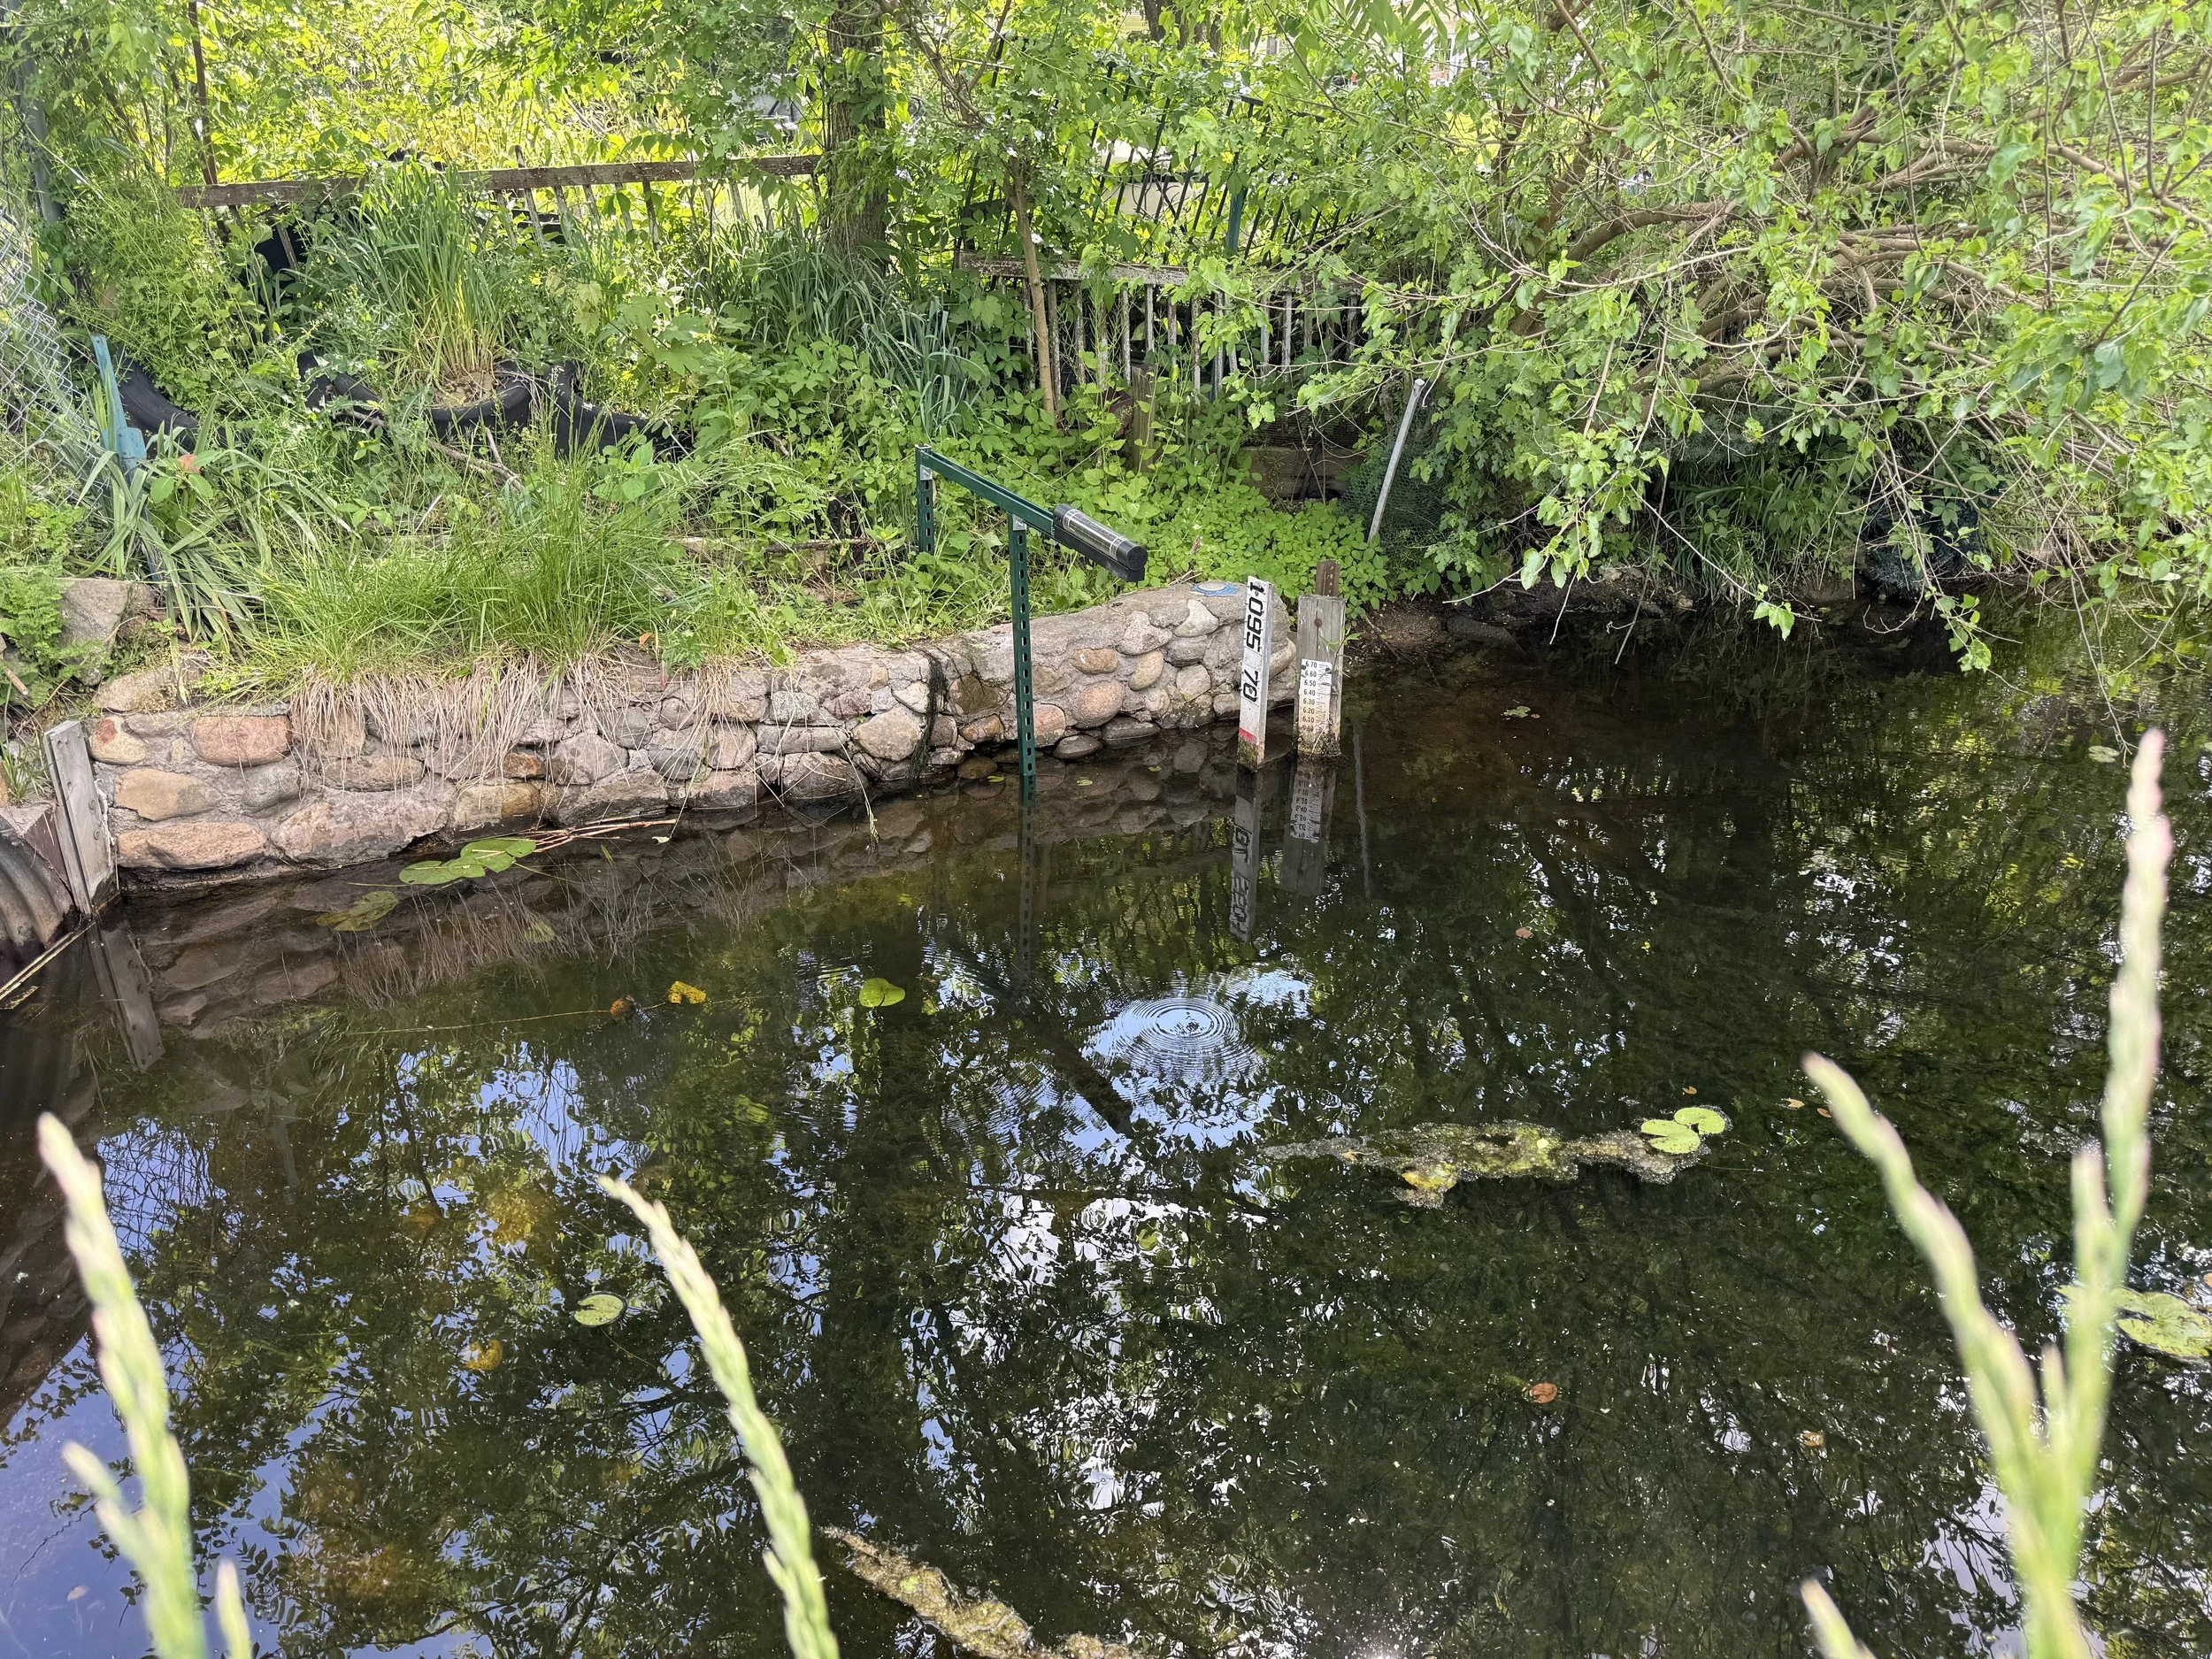
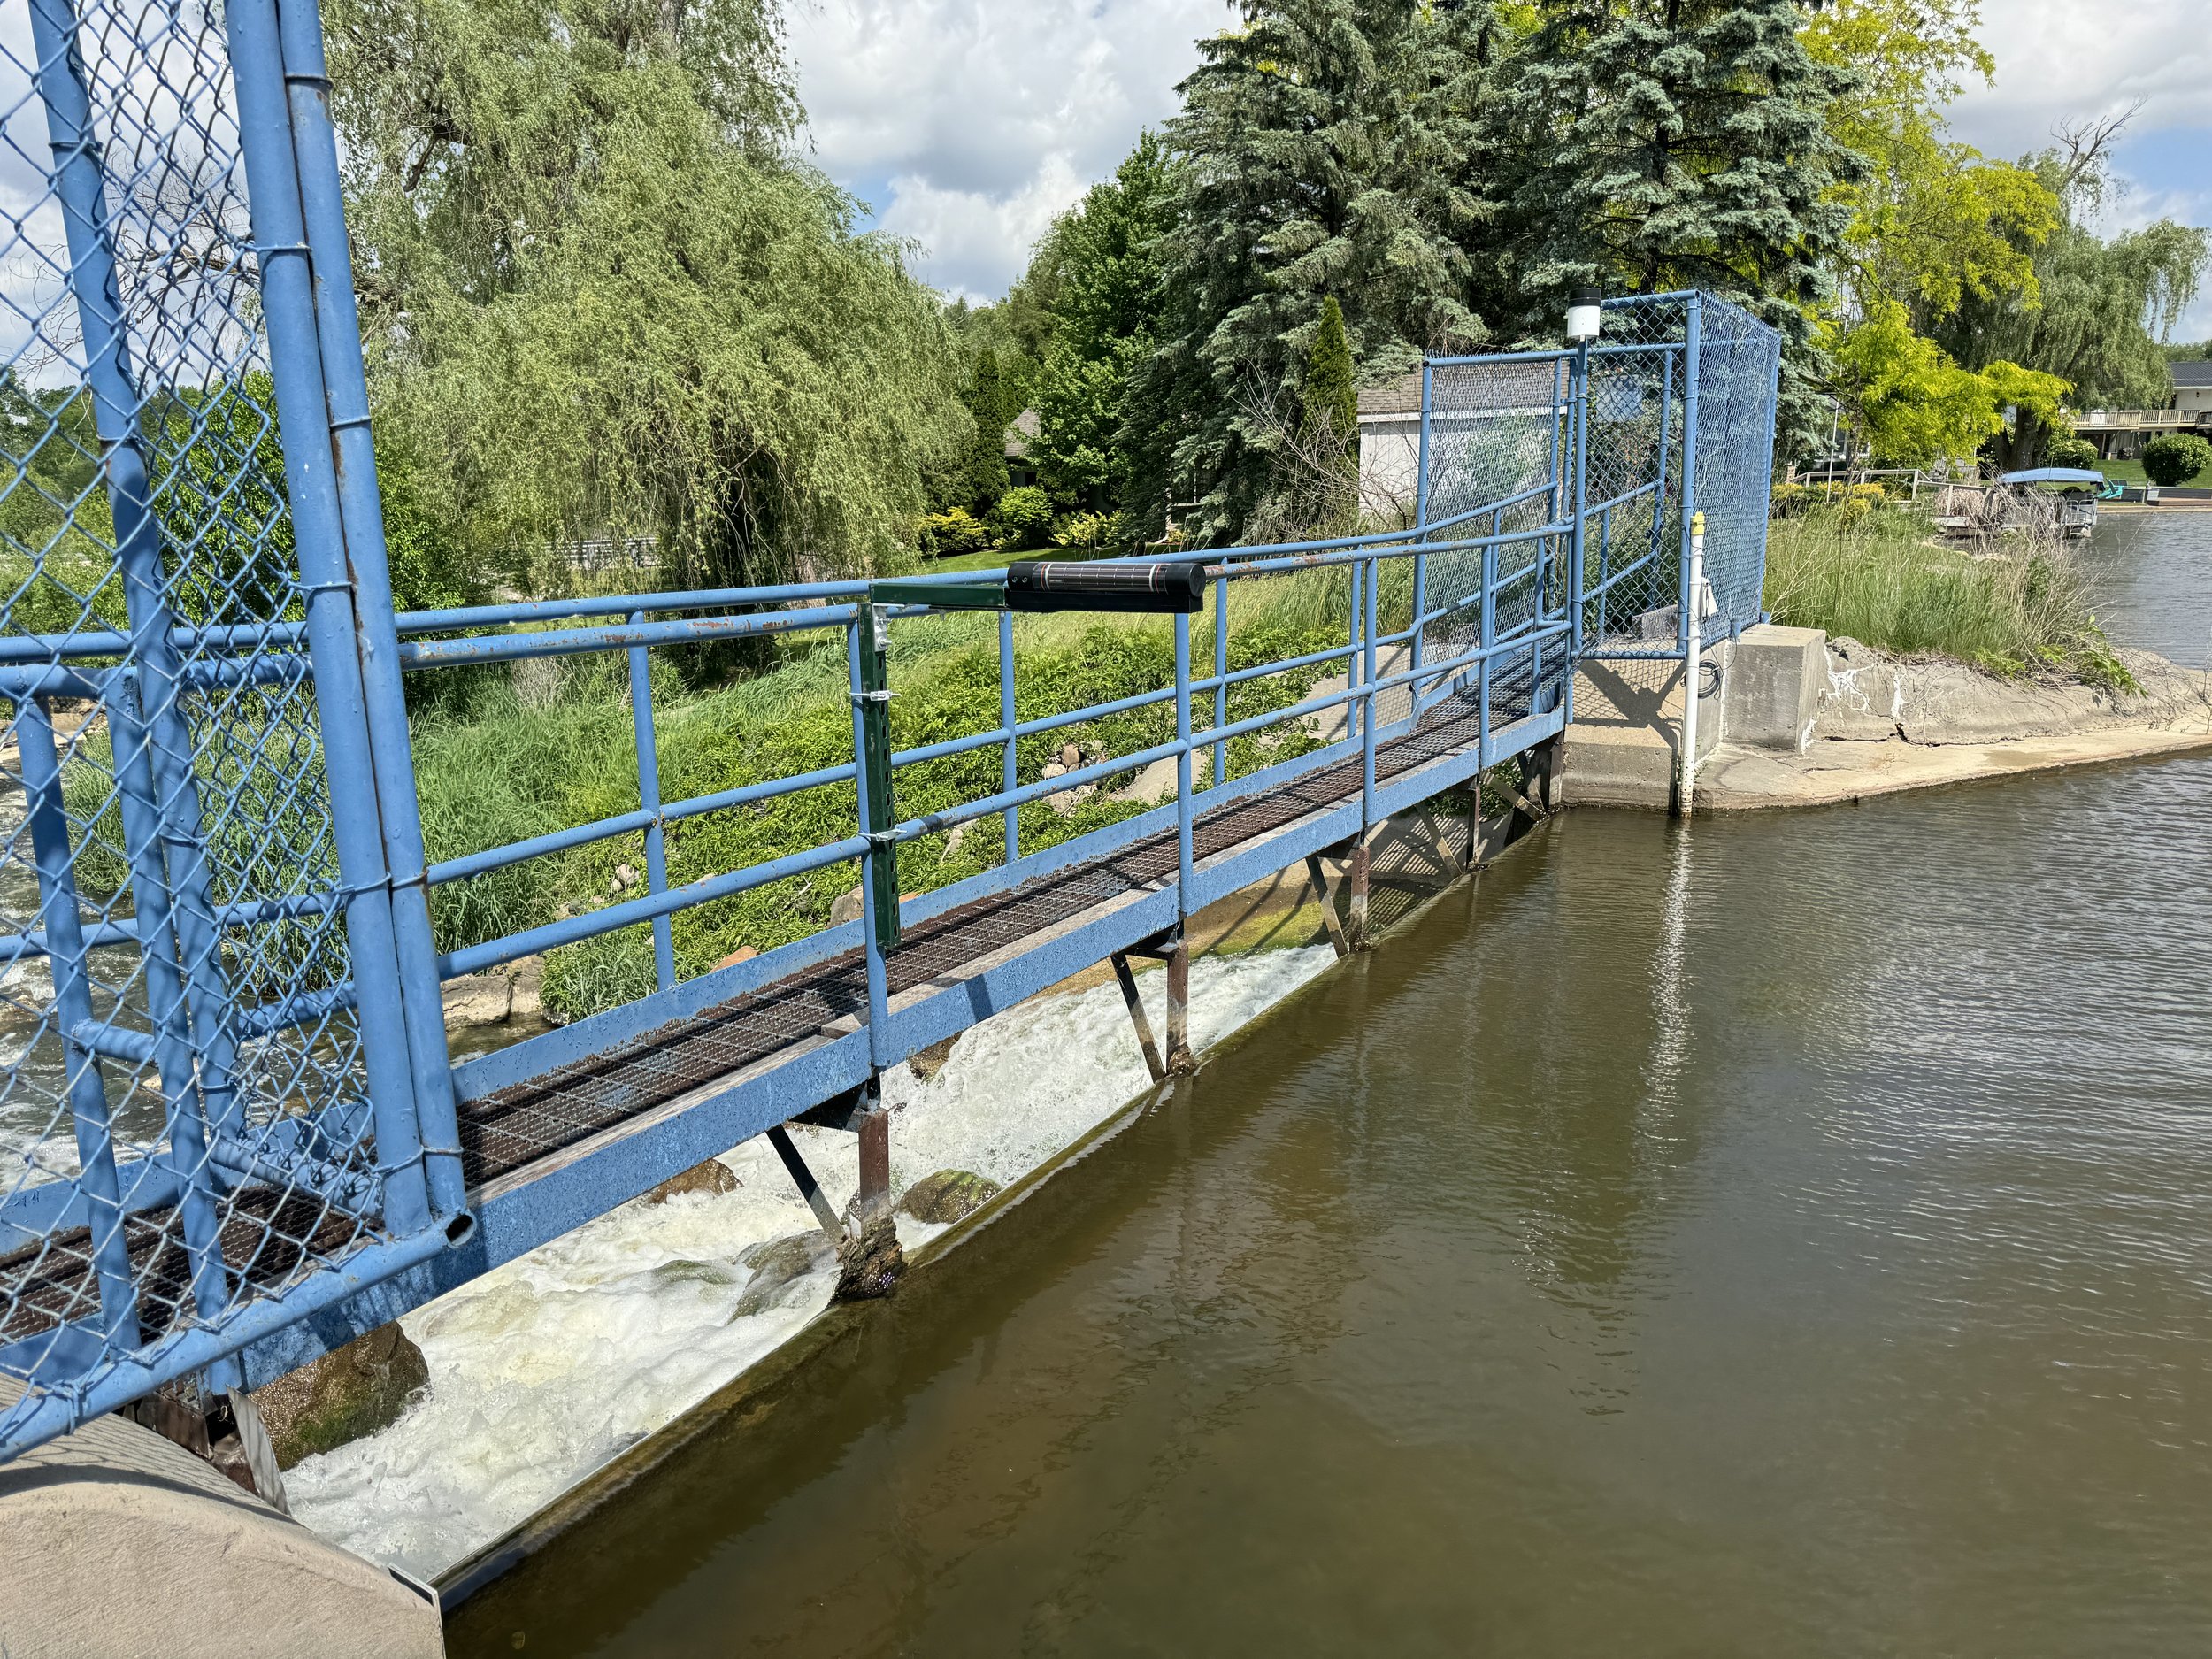
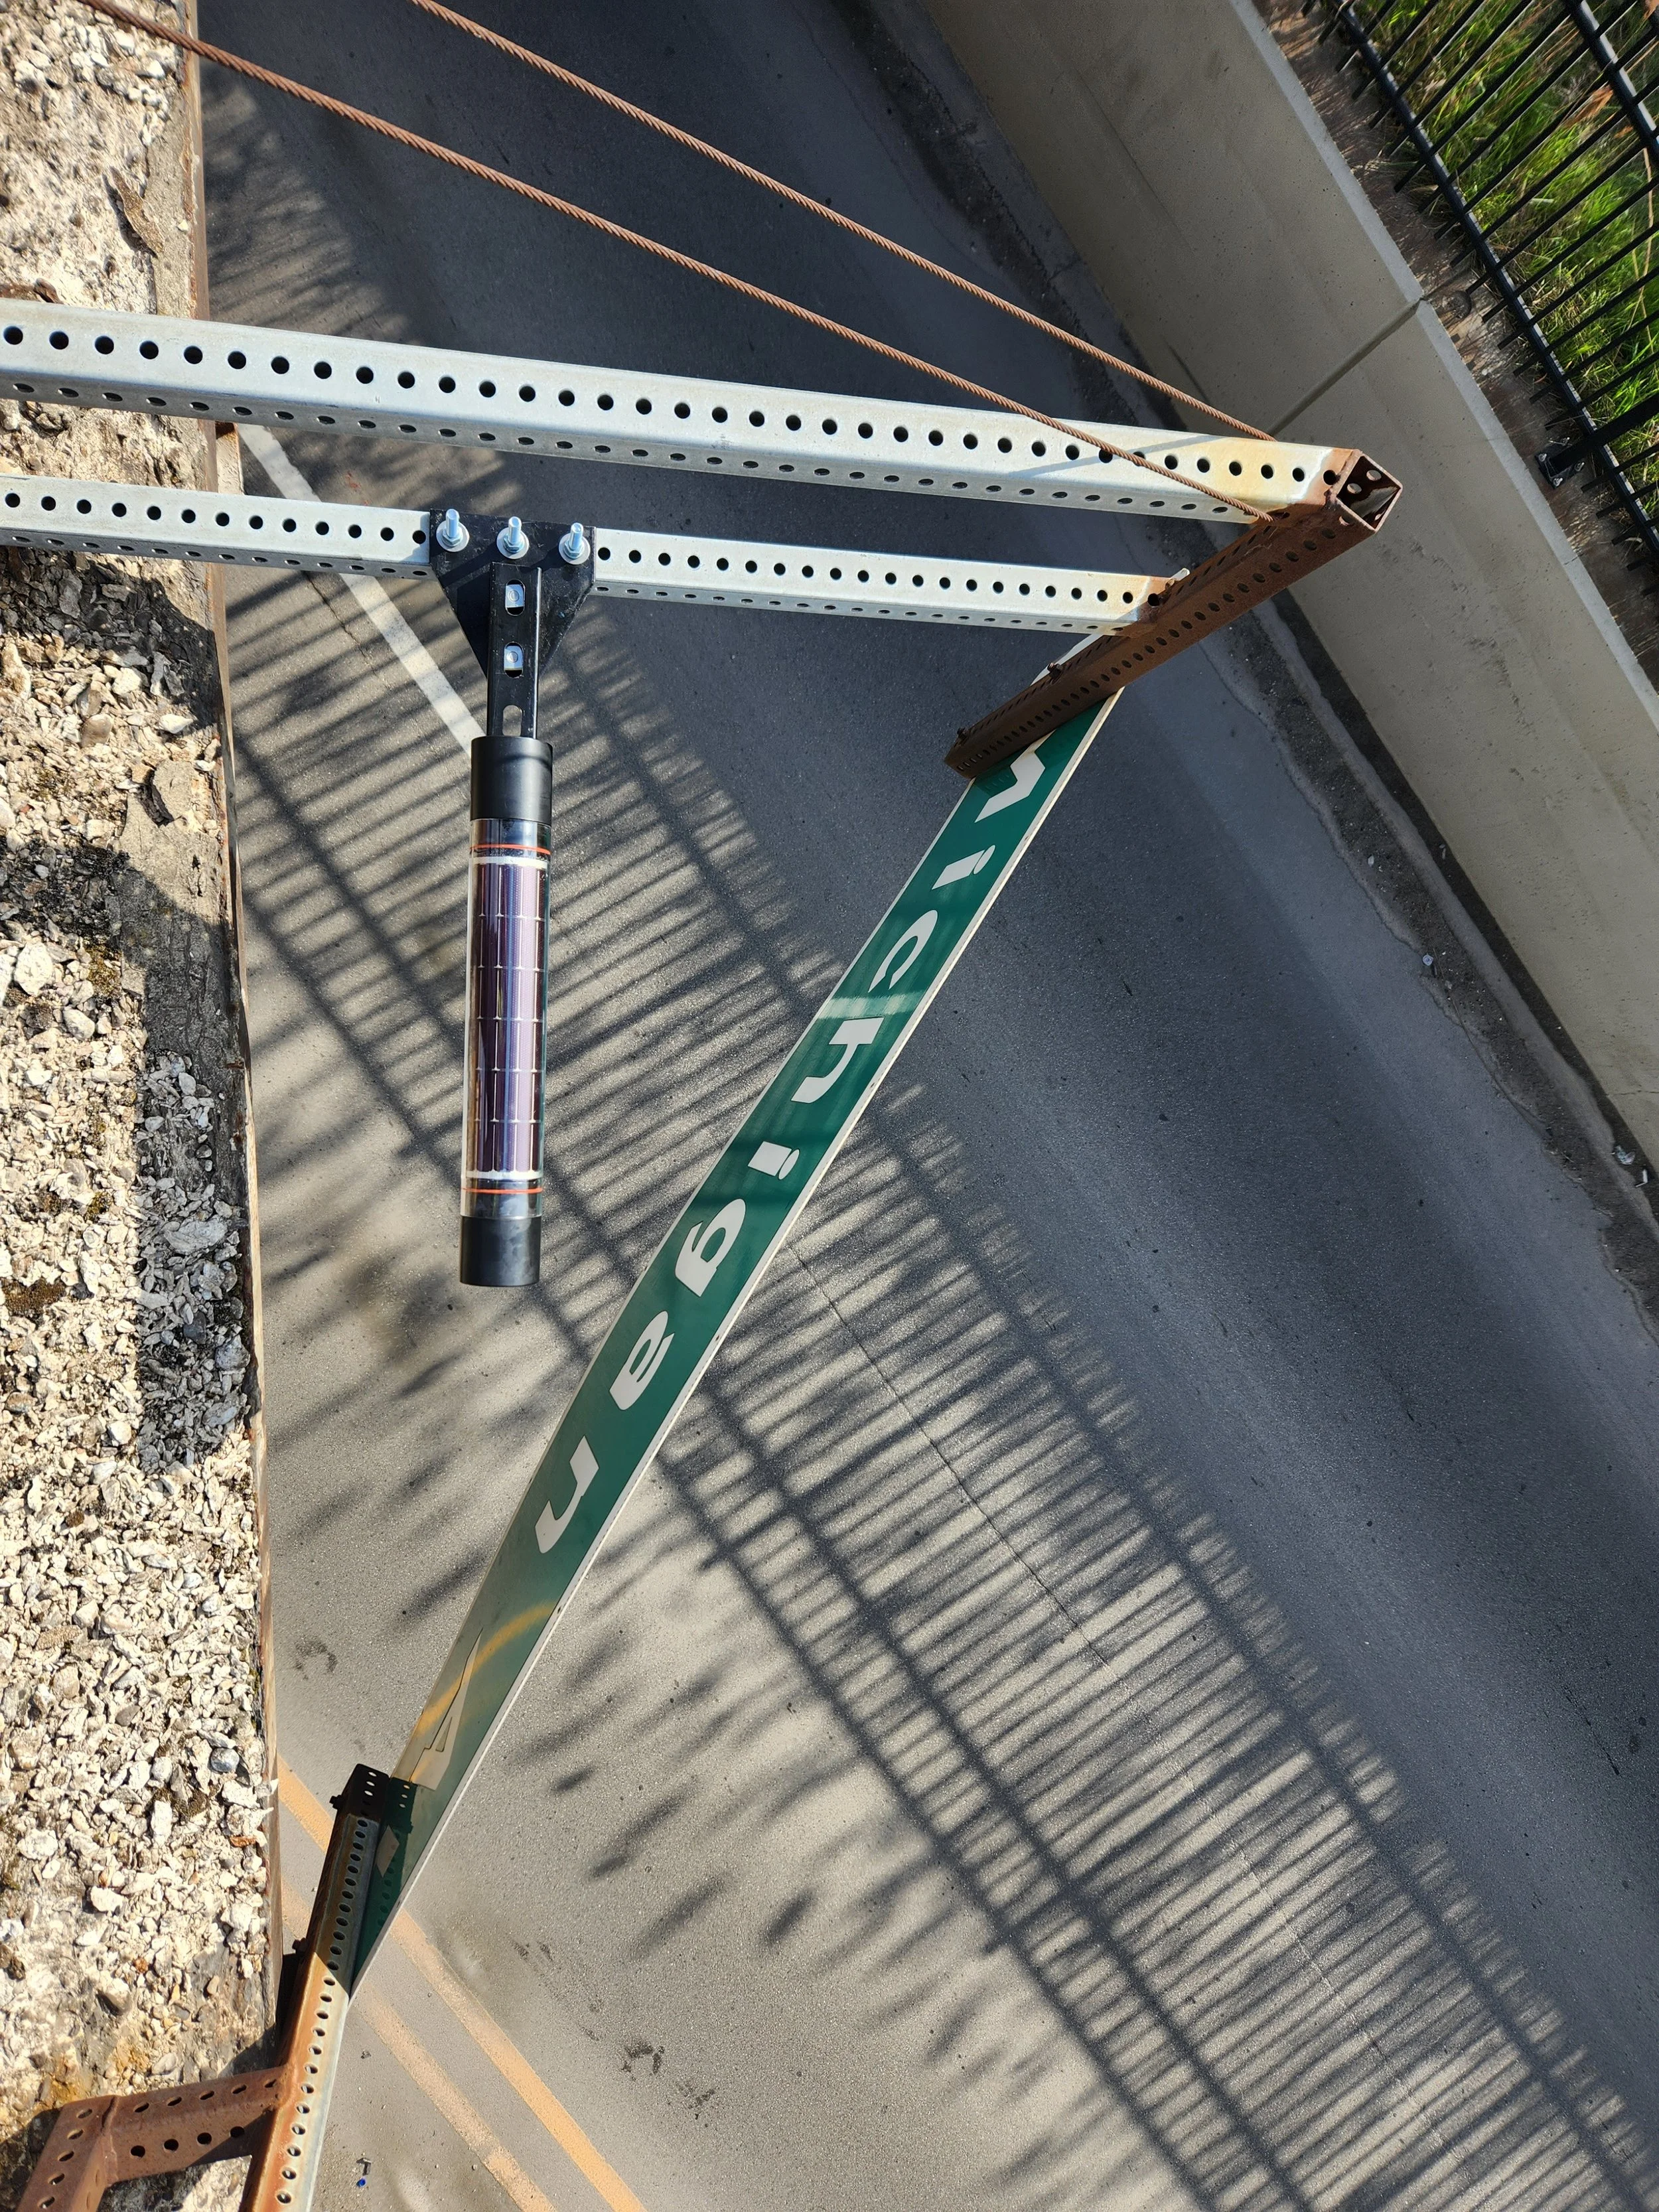
Easily deployed on bridges, culverts, or poles using standard strut channel fittings
Super fast maintenance - swaps out in a minute with a screwdriver
“The provided instructions made for a simple, hassle-free installation and the sensor required zero maintenance following the initial deployment. This was a significant time and budget saver for our project and the results were remarkably accurate.
It really has been a dream to work with the Hyfi sensors. I will be looking to use them again as much as I can where it makes sense.”
— Brandon Ellefson, Group Manager, OHM Advisors
Hyfi monitors can be installed just about anywhere.

Concrete Mount

Bridge Mount

Street Pole Mount
Data at your fingertips with real-time dashboards for desktop and mobile.
Quickly check field conditions or visualize past storm events. Download your data in one click in popular formats for easy reporting.
-
Password protected web and mobile apps
Easily add team members and staff
View interactive plots and weather data
Easily flip between map, list, and site views
Display data in your favorite datum (e.g. NAVD88)
Customize your time scales and see active alert levels at a glance
Quickly download data in popular formats, such as Excel or CSV
View site maintenance logs
Share dashboards with the public -- add to your website or we can host it for free!

Post Mount
Proven to last, even through hurricanes.
Built with a weather-proof, military-grade outer casing, Hyfi monitors can be installed year-round and keep reporting data, even through major storms, long icy winters, and intense desert summers.
Set up customized alerts to get notified via email, text, or phone call.
Never miss a critical event by setting up alerts just the way you like them.
Hyfi alerts can be customized right from your dashboard. Create as many alerts as you want, both for yourself and your whole team.

Share your data with anyone you want.
Share access to your dashboards with as many team members as you want. Go further and create customized public-facing dashboards to keep your community informed.
Data can be easily exported in csv, png, pptx, and pdf formats. You can even connect Hyfi data to other applications through the Hyfi API.
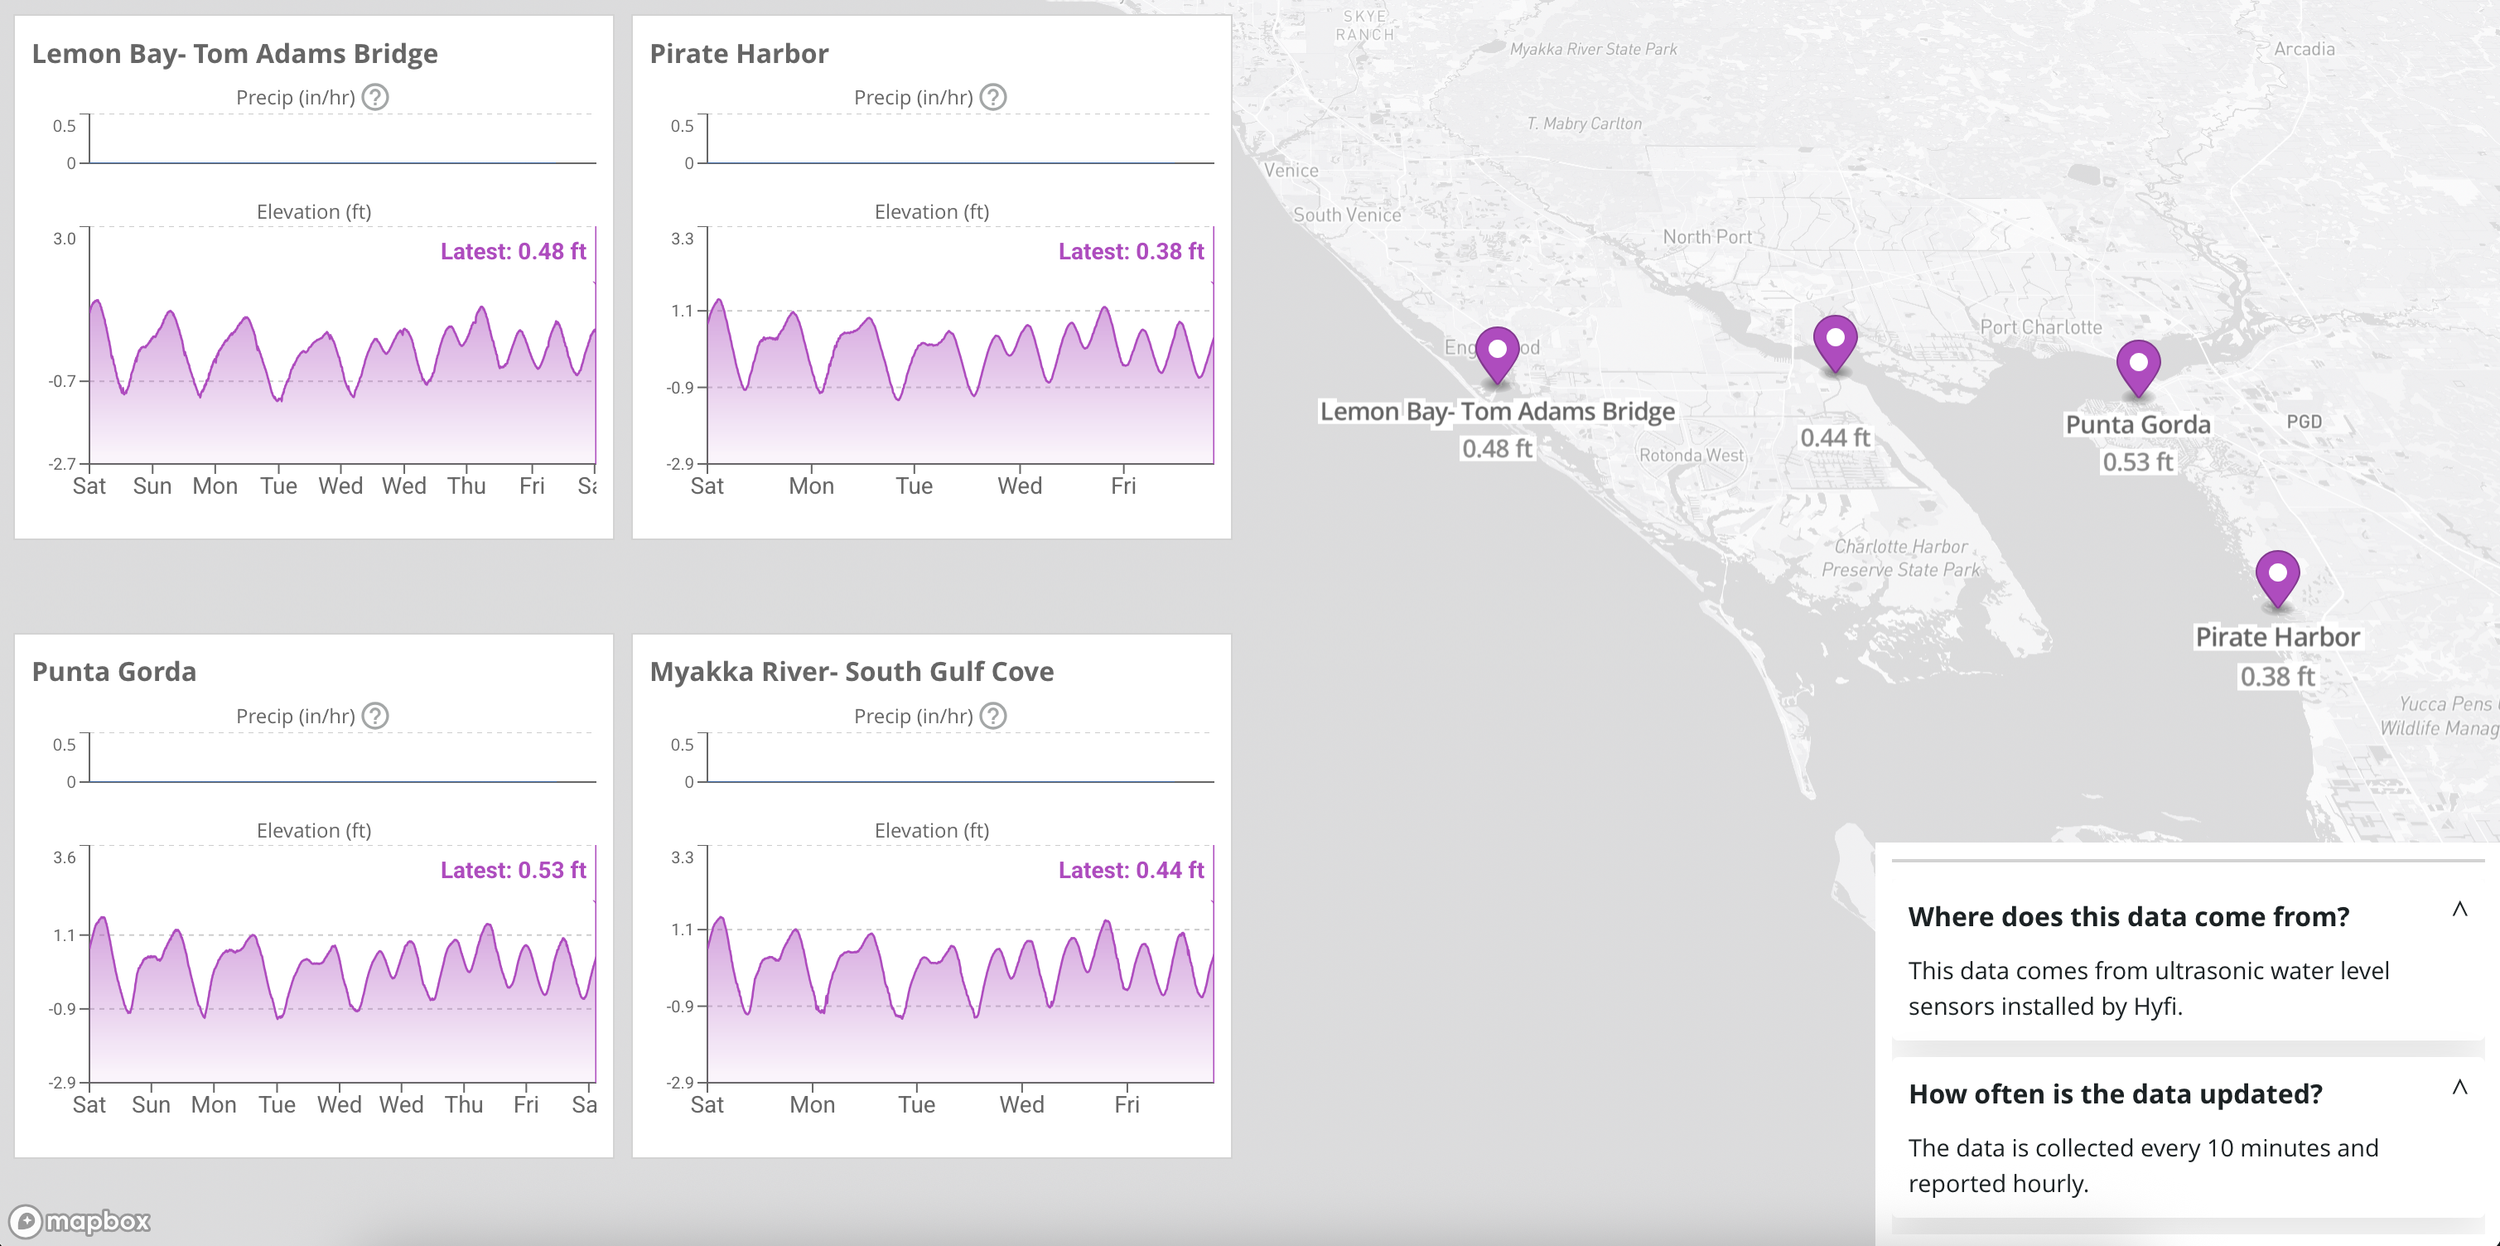
Get the most our of your data with AI & analytics.
Squeaky clean data and flood maps
Our AI & Analytics suite ensures top-notch data quality and offers advanced features like real-time and predictive flood mapping, automated event analysis, interactive data visualizations, and more.
-
Our AI & Analytics suite ensures top-notch data quality and advanced data processing. Our AI monitors data continuously, and verifies it in real time for accuracy. We can integrate data into spatial flood maps, giving you coverage at locations not covered by monitors. Easily integrate data from USGS and NOAA, add your own meters and flood stages.
Postcards from the field