
Viewing the Weather Forecast in Your Hyfi Portal
This page shows you how to view the weather forecast for your Hyfi monitoring sites.
Table of Contents
The Hyfi Weather Map
The Hyfi weather map is a page in your Hyfi portal that shows the weather forecast on a map of your Hyfi water level monitors. The weather map allows you to:
Check the weather forecast over the next 3 hours, 12 hours, and 7 days
Monitor precipitation, temperature, and wind speed
See how the forecast changes from one part of your network to another.
Watch how storms evolve through radar images ranging from 6 hours ago to 6 hours in the future.
Where Does the Data Come From?
All weather forecast data used in the Hyfi Weather Map comes from the High-Resolution Rapid Refresh (HRRR) weather model, run by the National Oceanic and Atmospheric Administration (NOAA). You can learn more about this data here.
Radar data is also sourced from NOAA’s NEXRAD radar network, which also powers public weather sites like weather.gov.
How to Access
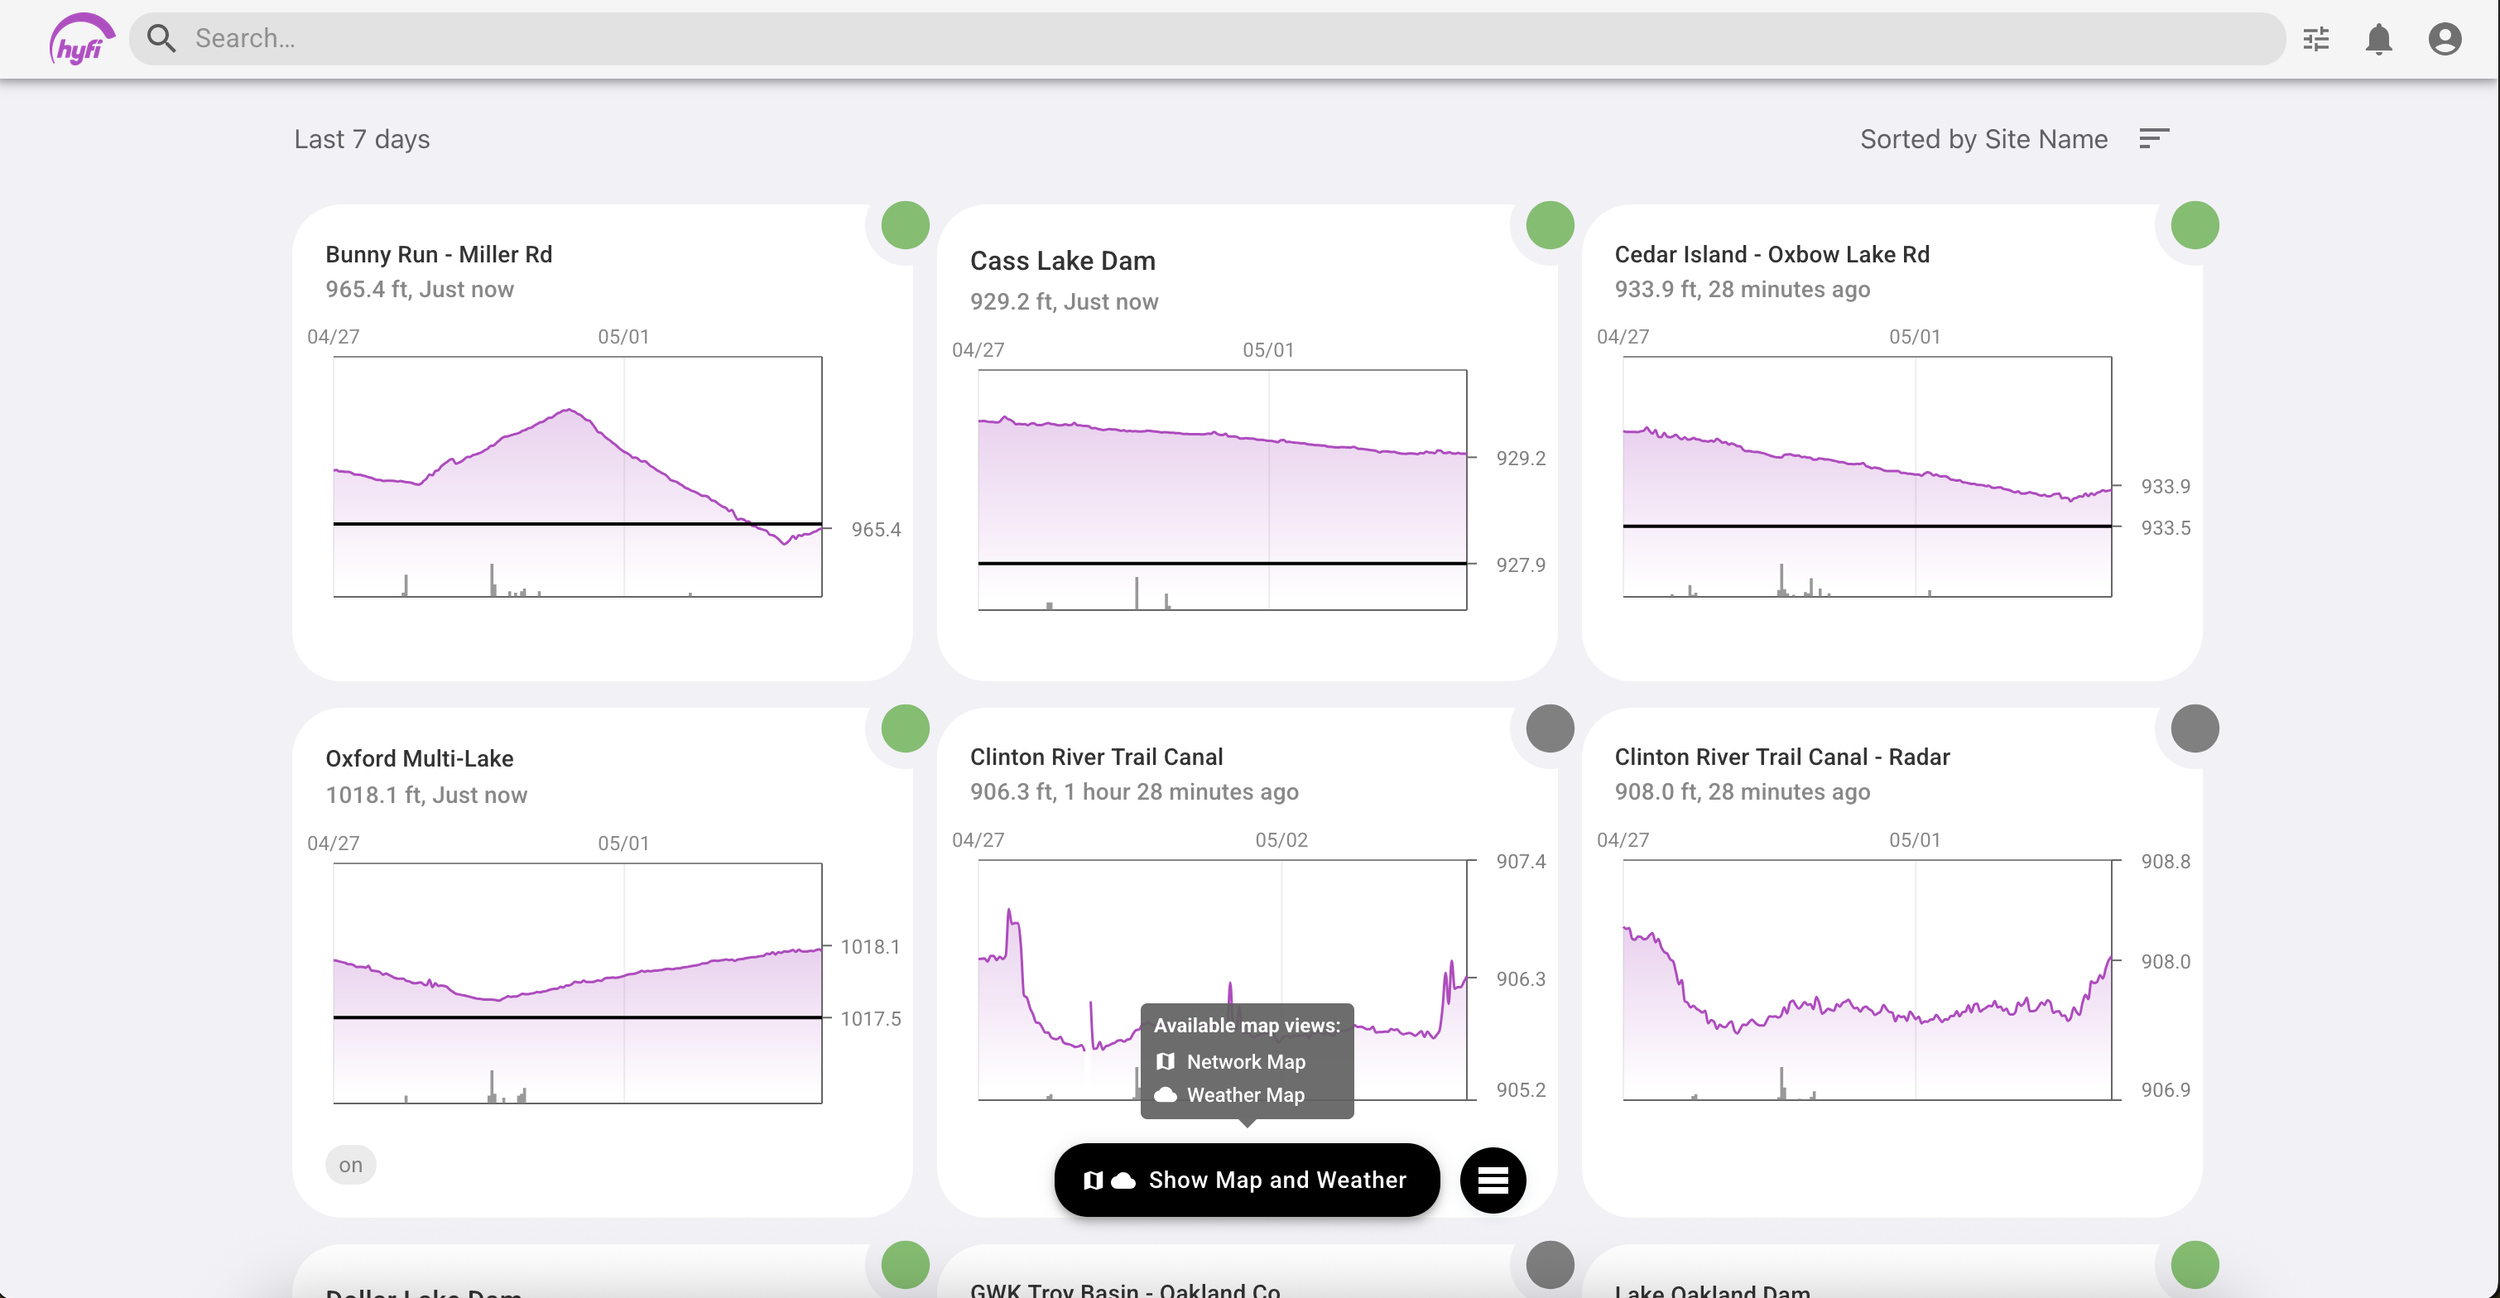
Log in to your Hyfi portal.
Click the black "Show Map and Weather" button at the bottom of the screen.
The Hyfi Weather Map will open.
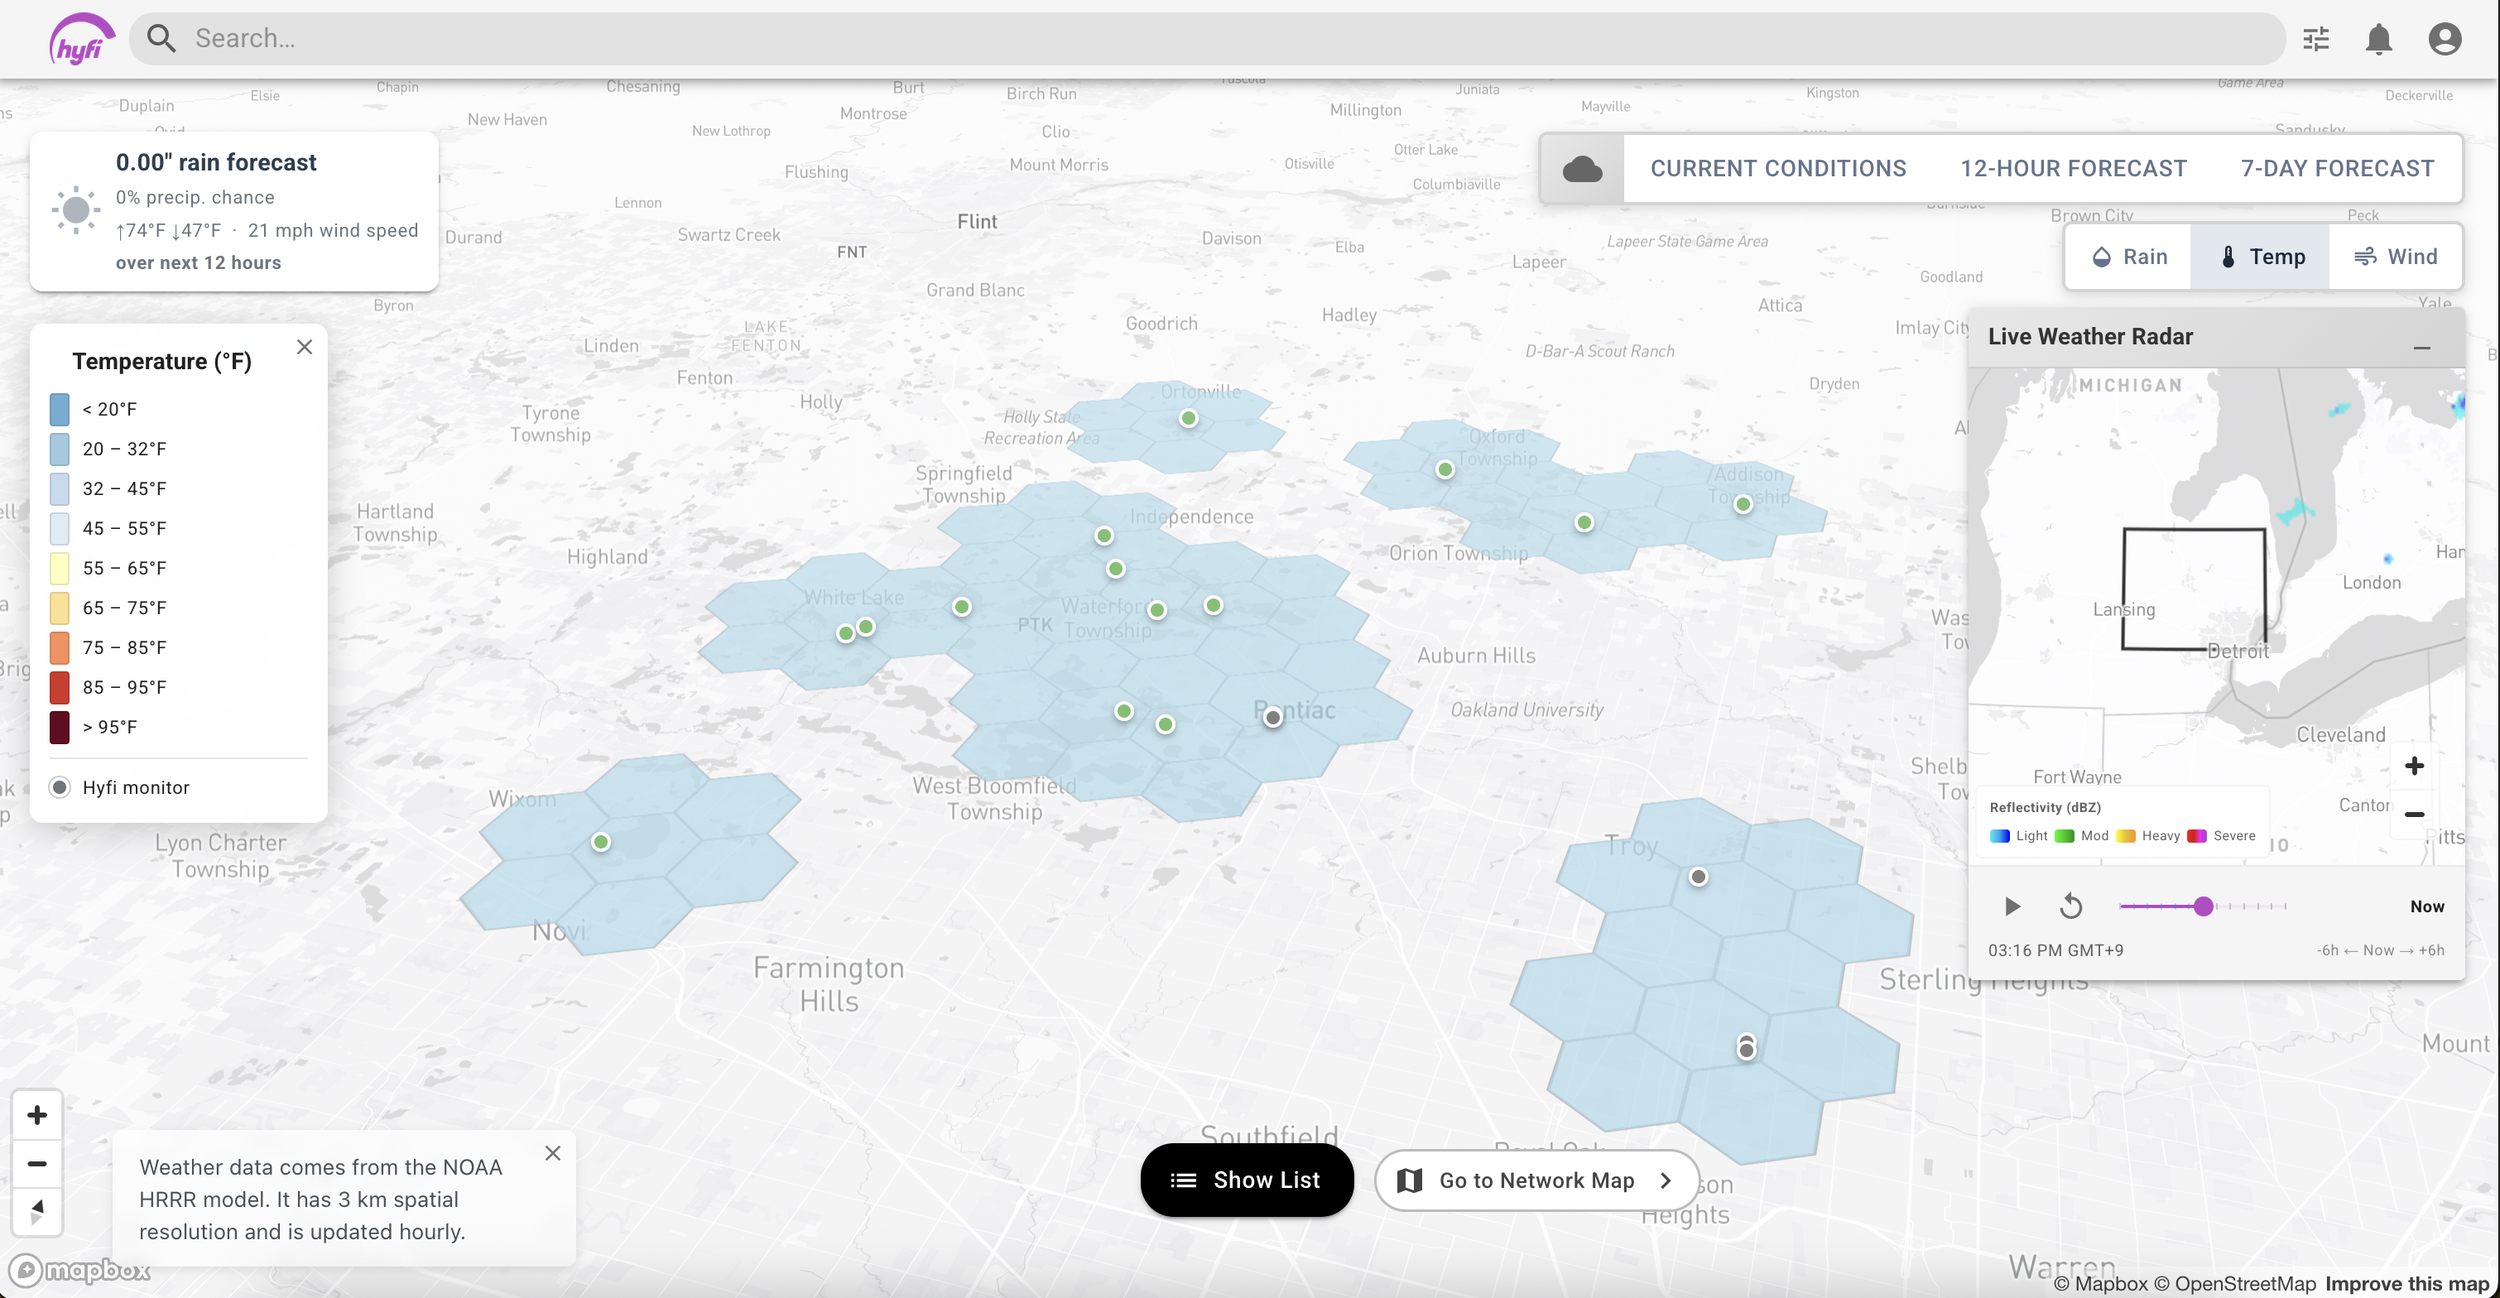
A Tour of the Hyfi Weather Map
By default, the Hyfi weather map will show forecast precipitation over the next 12 hours.
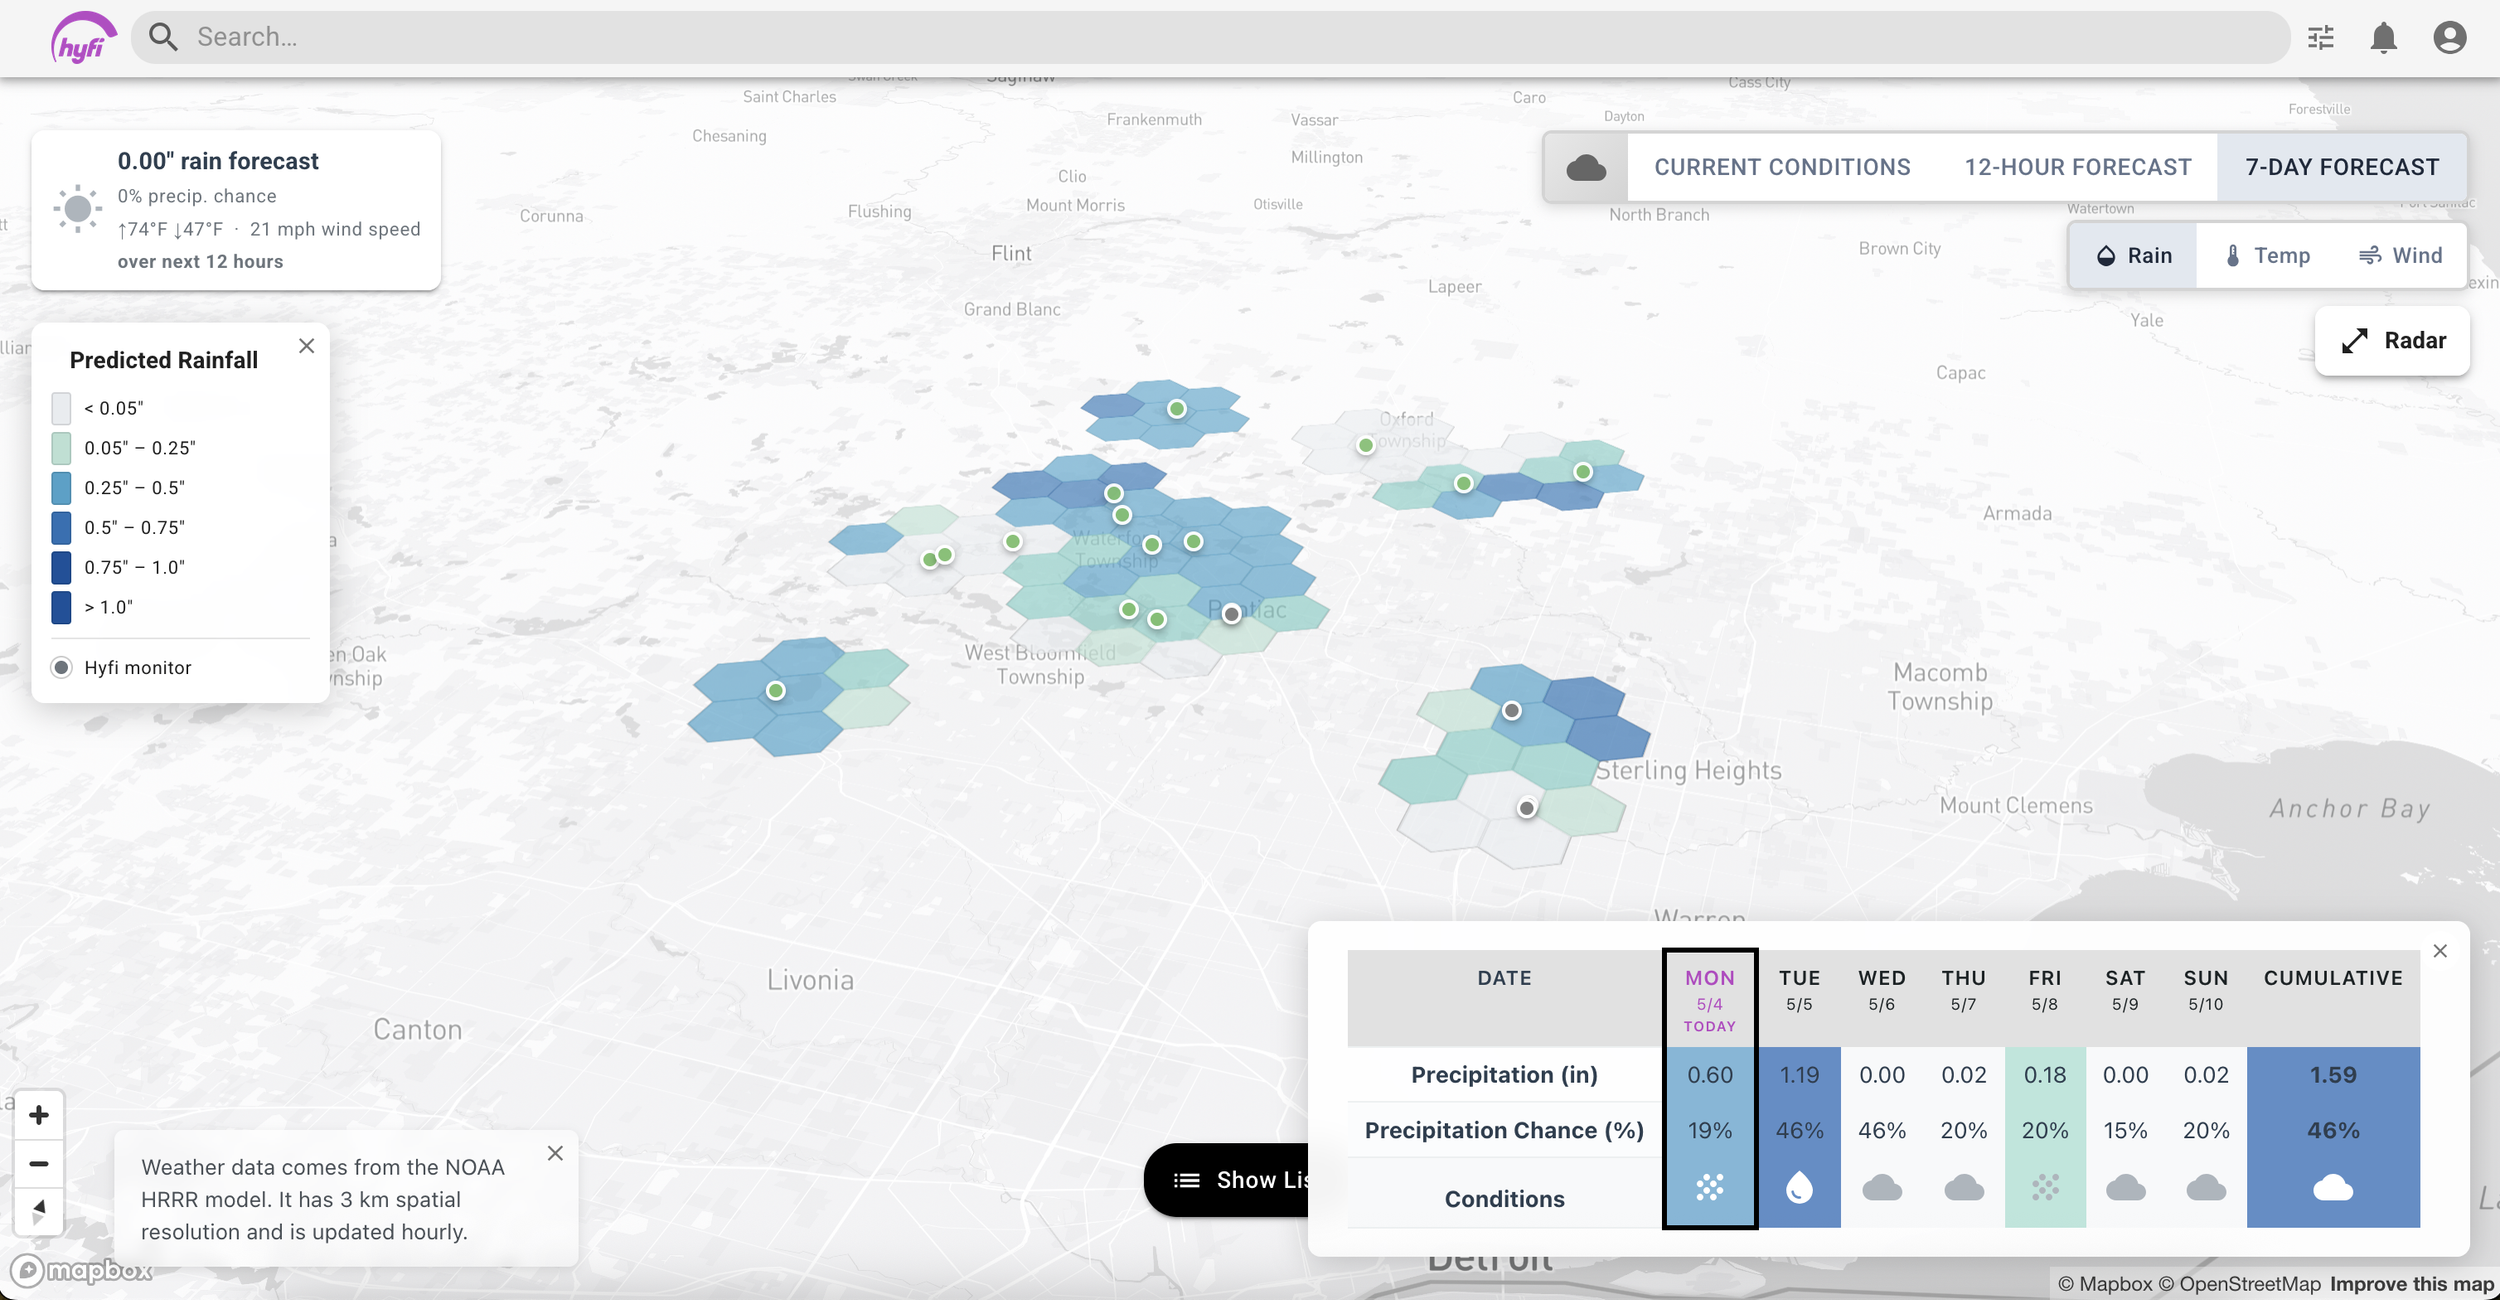
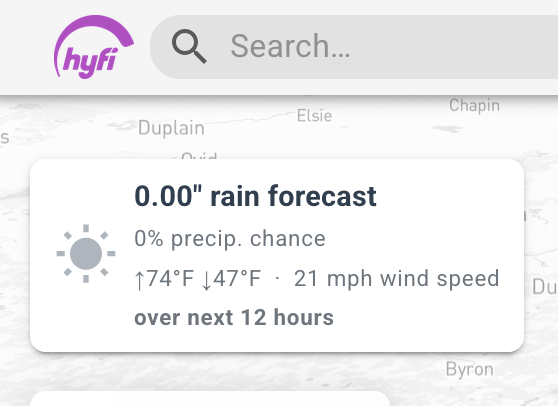
A summary panel in the upper left corner displays the expected precipitation, high and low temperature, and maximum wind speed over the next 12 hours.
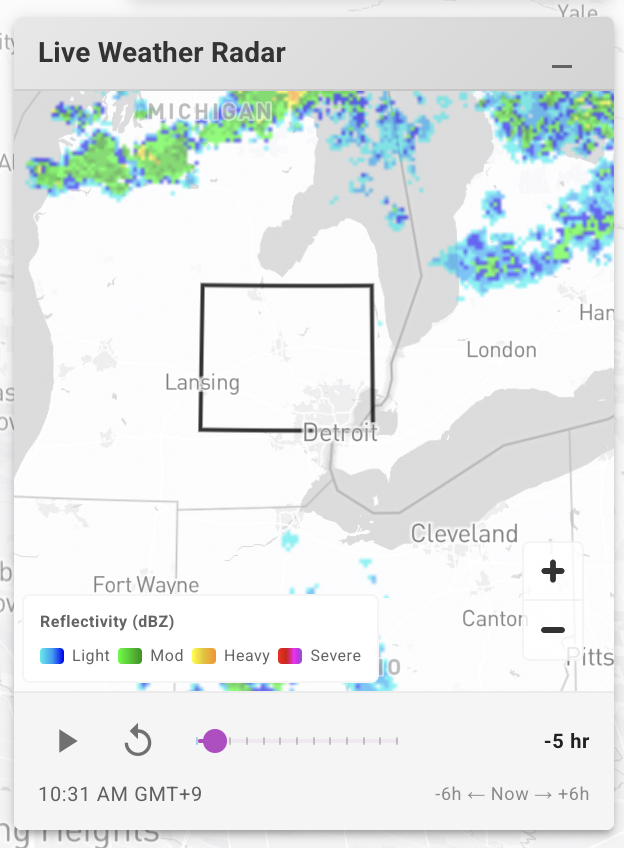
On the right side of the page, the Live Weather Radar panel shows evolving weather conditions starting 6 hours ago and ending 6 hours in the future. This radar animation can help you understand how a storm is predicted to evolve over time.
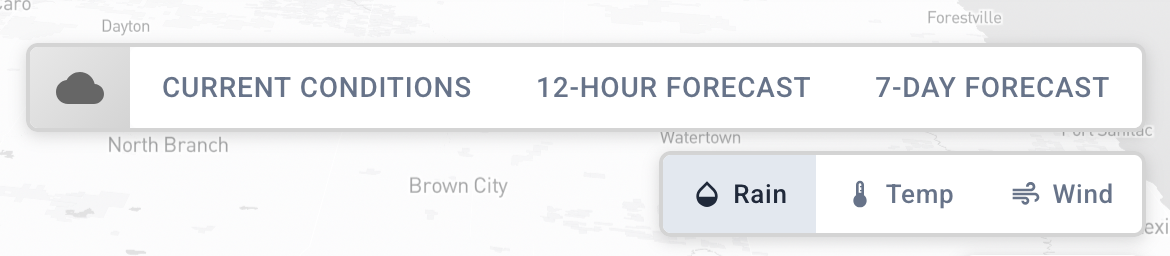
"Current Conditions" shows the forecast in 15-minute steps over the next 3 hours.
"12-Hour Forecast" shows the forecast in 1-hour steps over the next 12 hours.
"7-Day Forecast" shows one row per day over the next week.
“Rain” shows forecast precipitation over the selected time period.
“Temp” shows the average forecast temperature over the selected time period (except for during the “7 day forecast”, where it shows both the expected high and low temperature.)
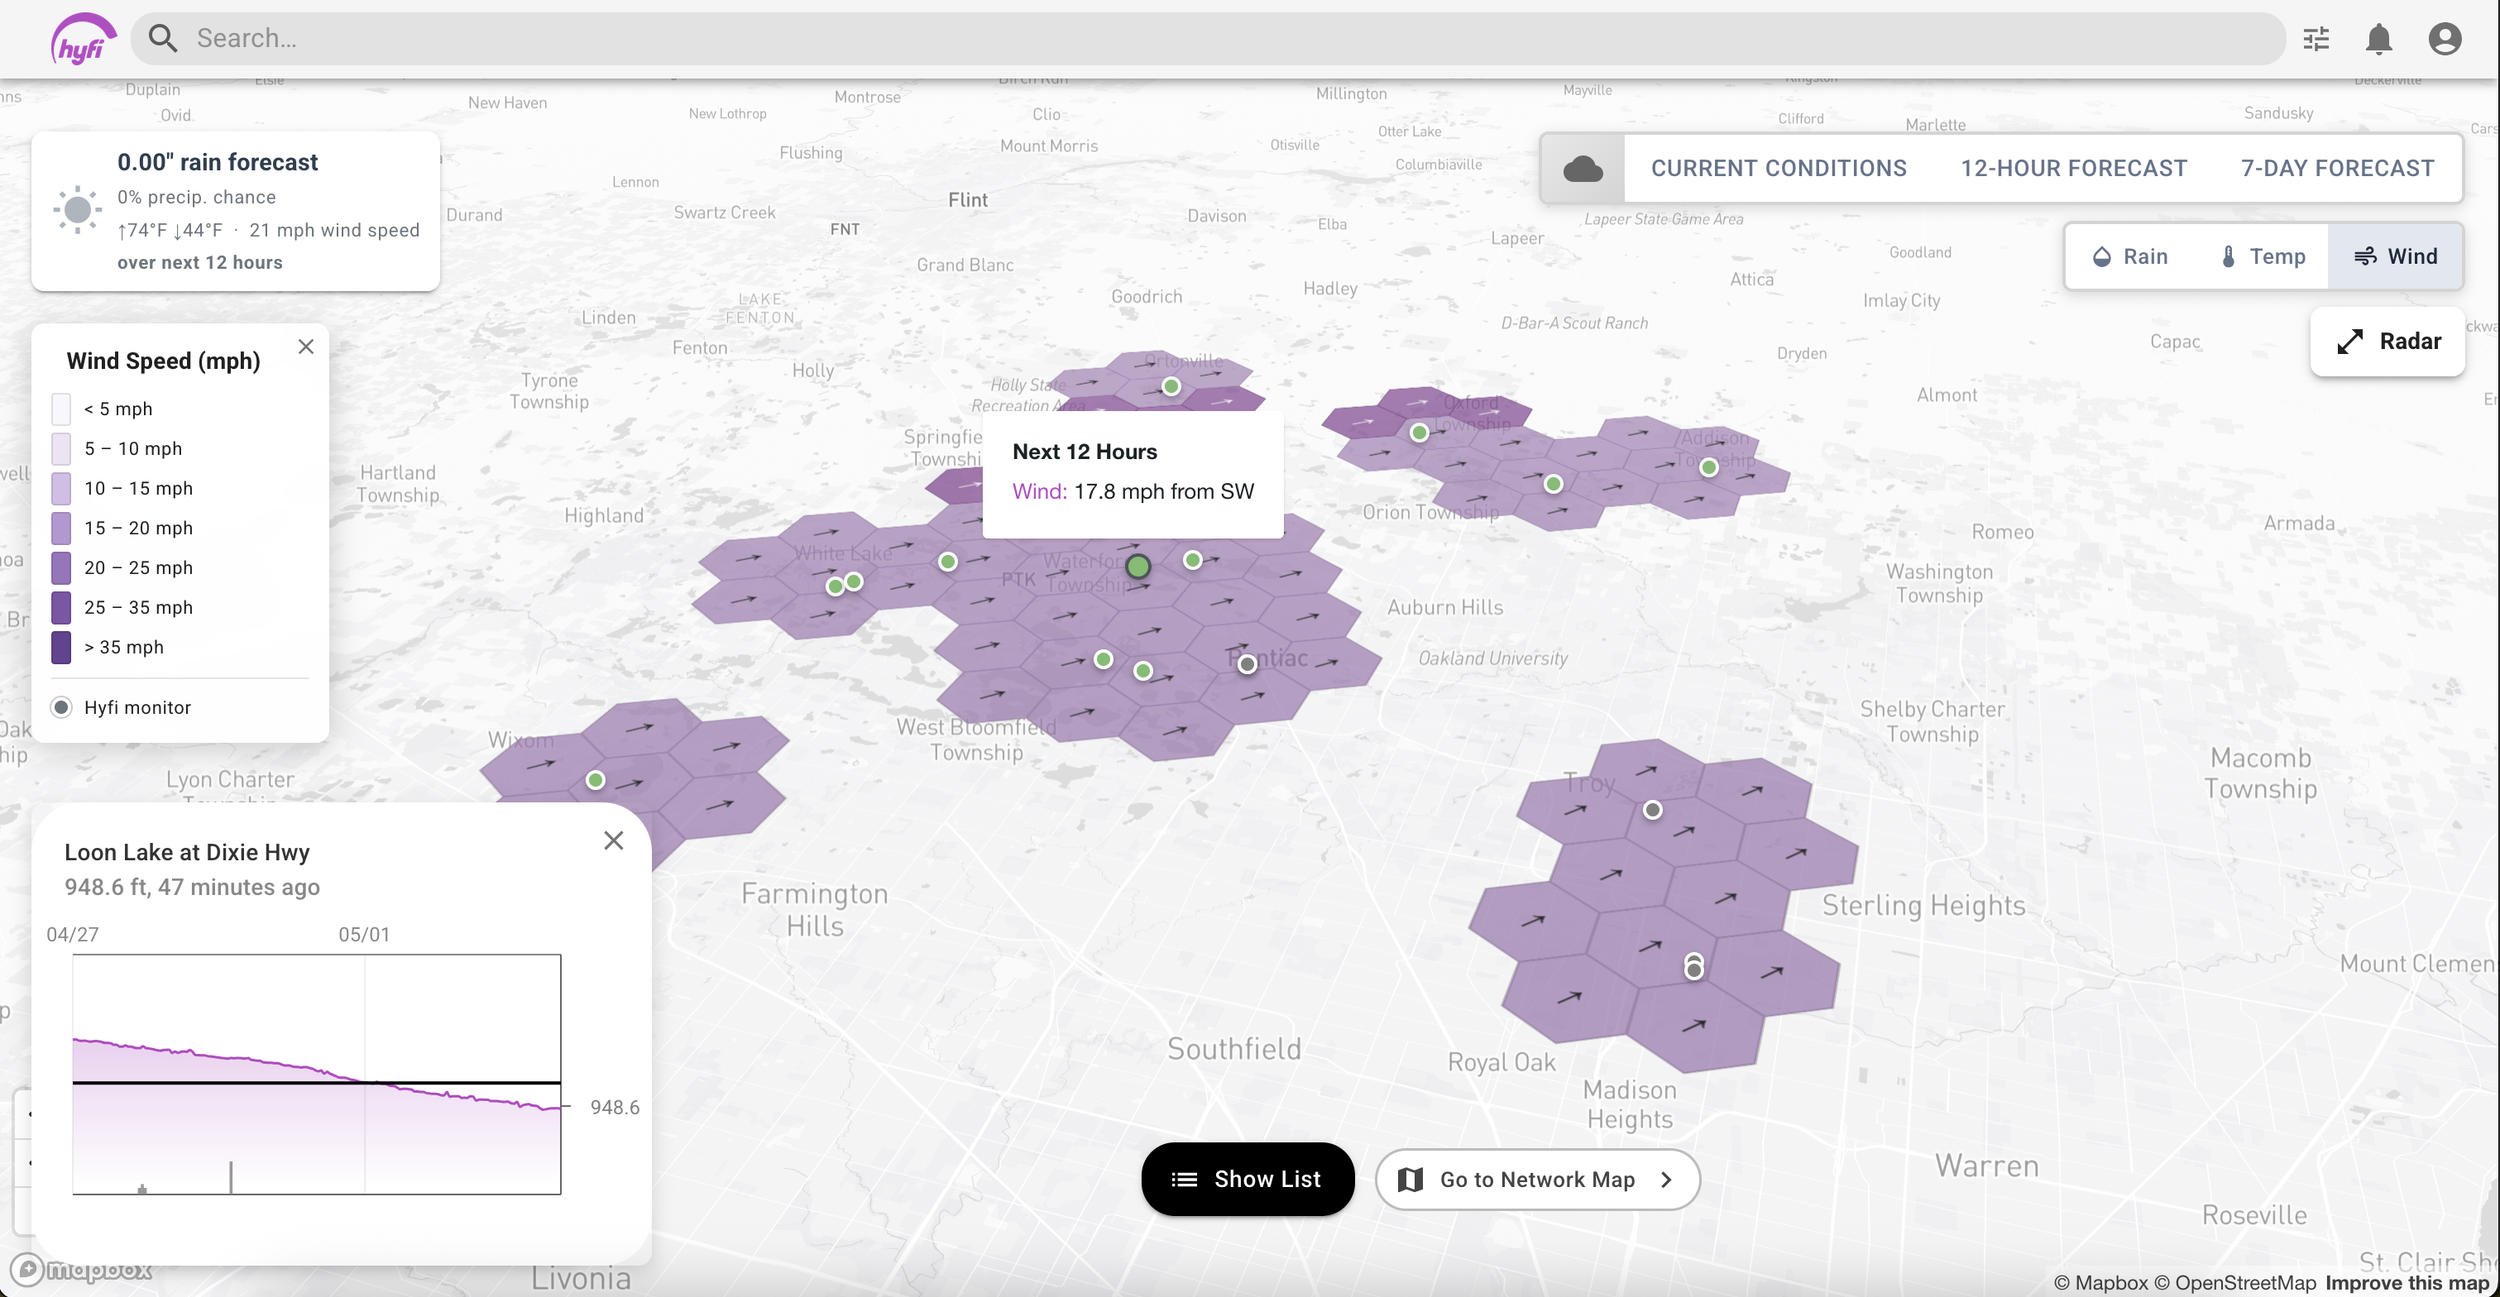
“Wind” shows the maximum forecast wind speed and wind direction over the selected time period.
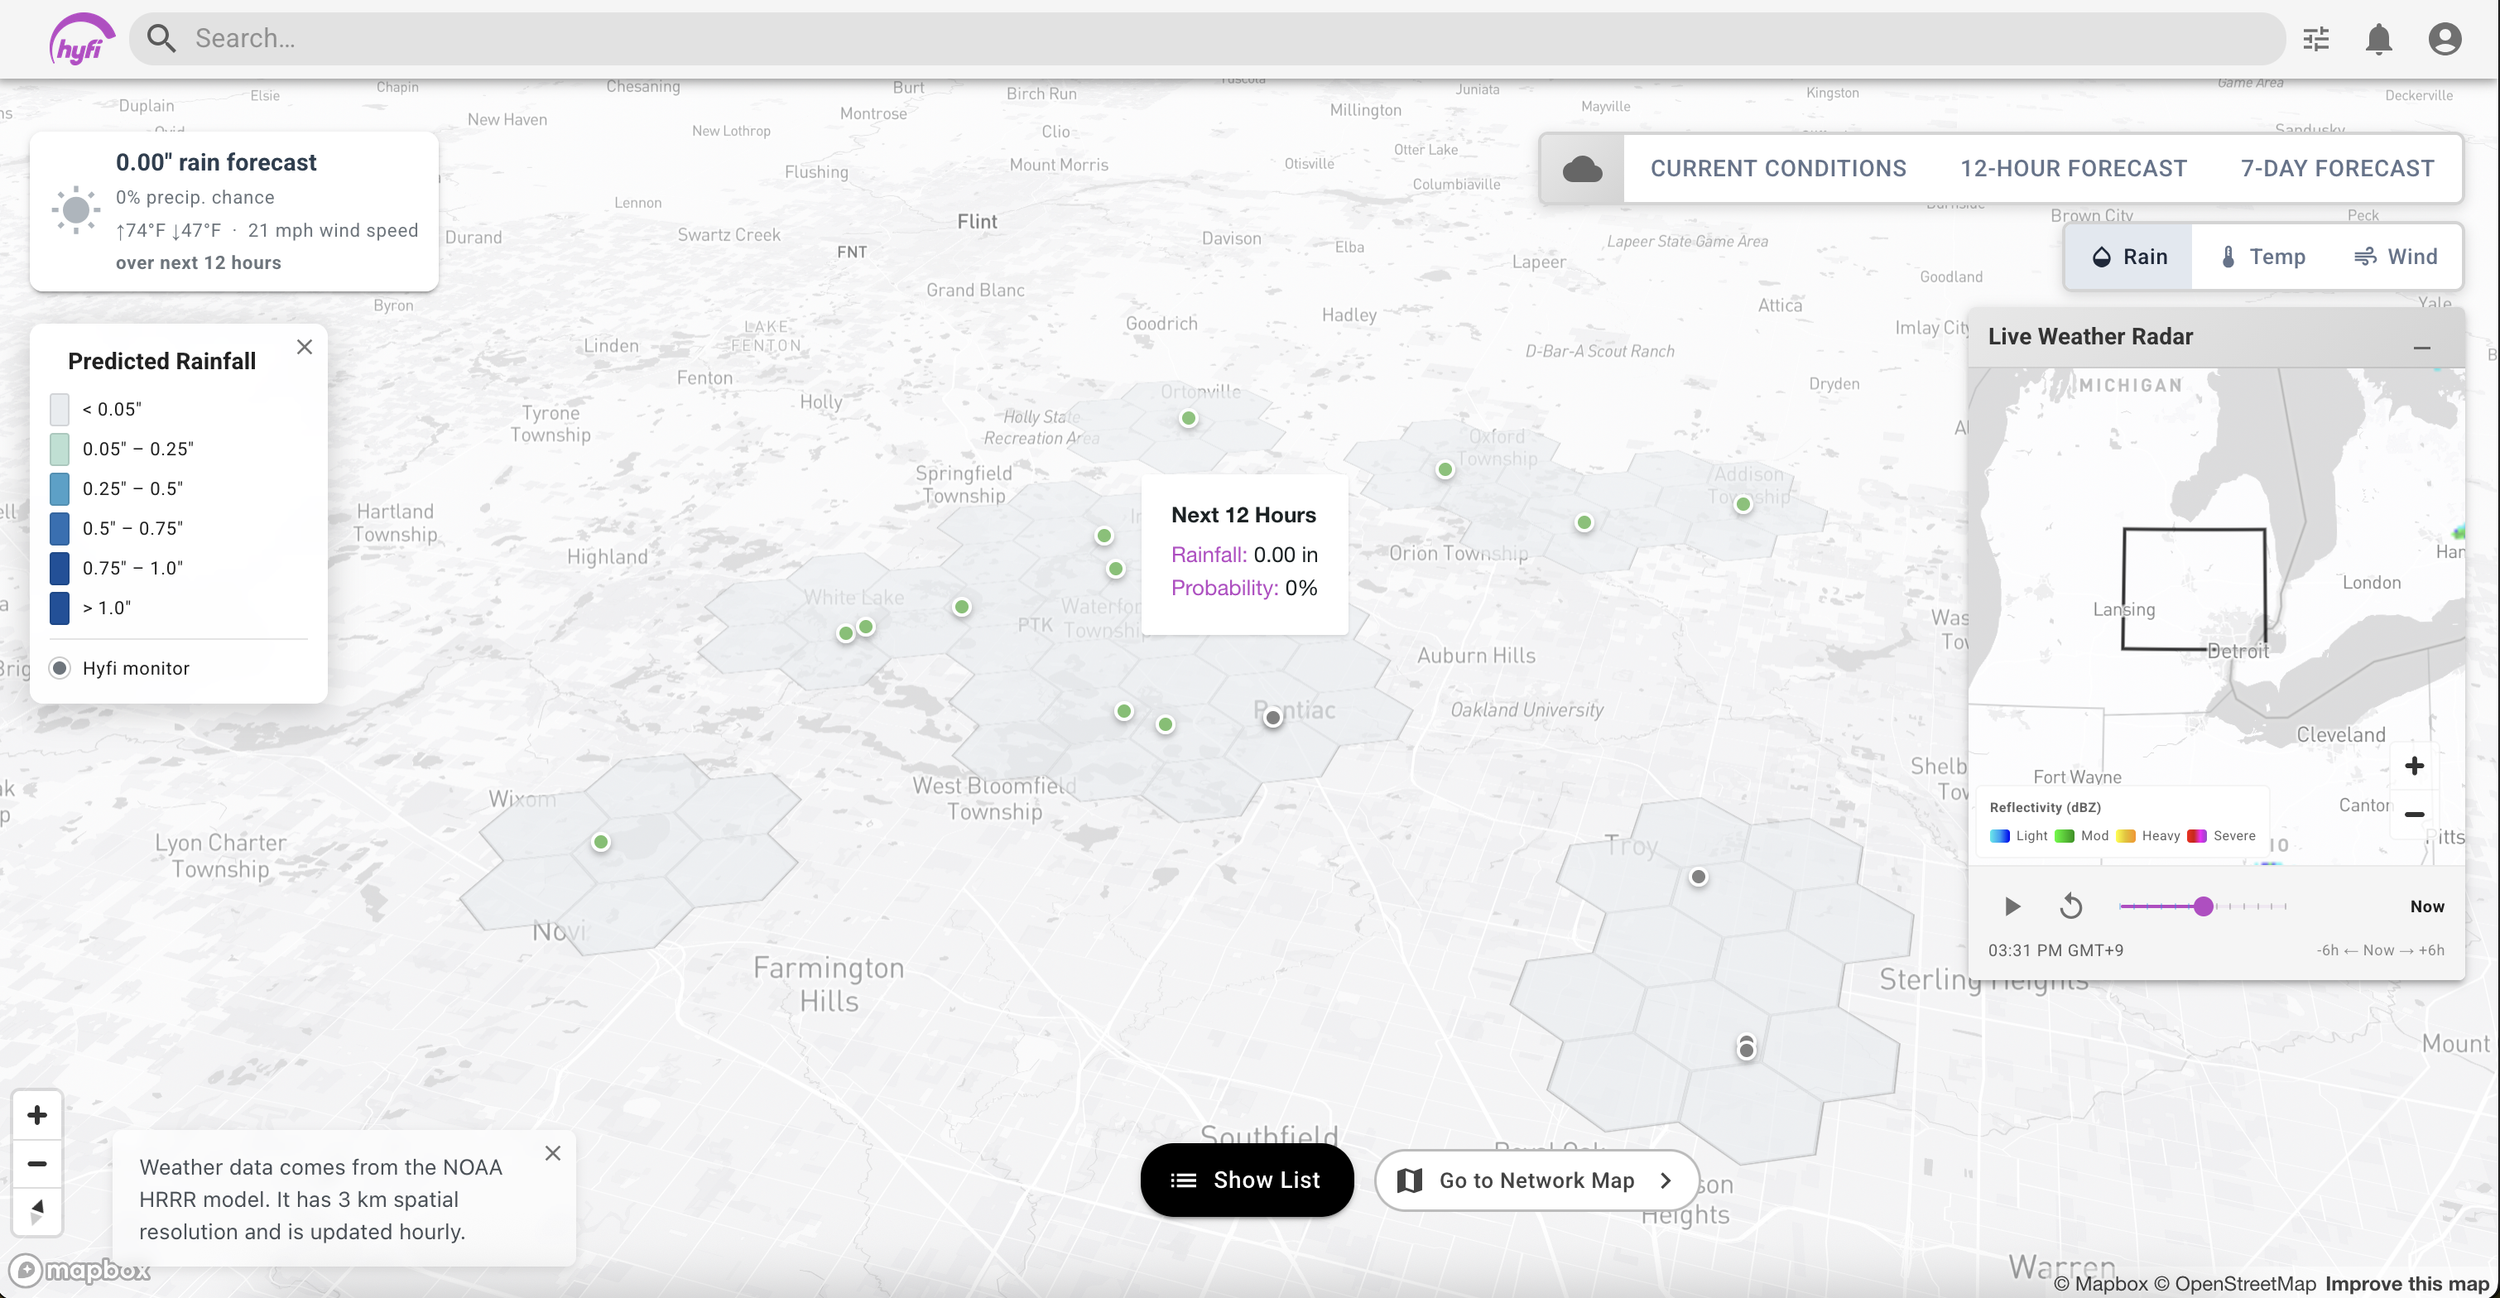
Move your mouse over a column in the table and the map will update to show the forecast at that time. Click a column to lock the map on that time so you can explore it in detail.
If you want to check the data coming from a Hyfi monitor in your network while looking at the weather map, you can click on the circular monitor marker and a data preview will appear in the lower left corner.
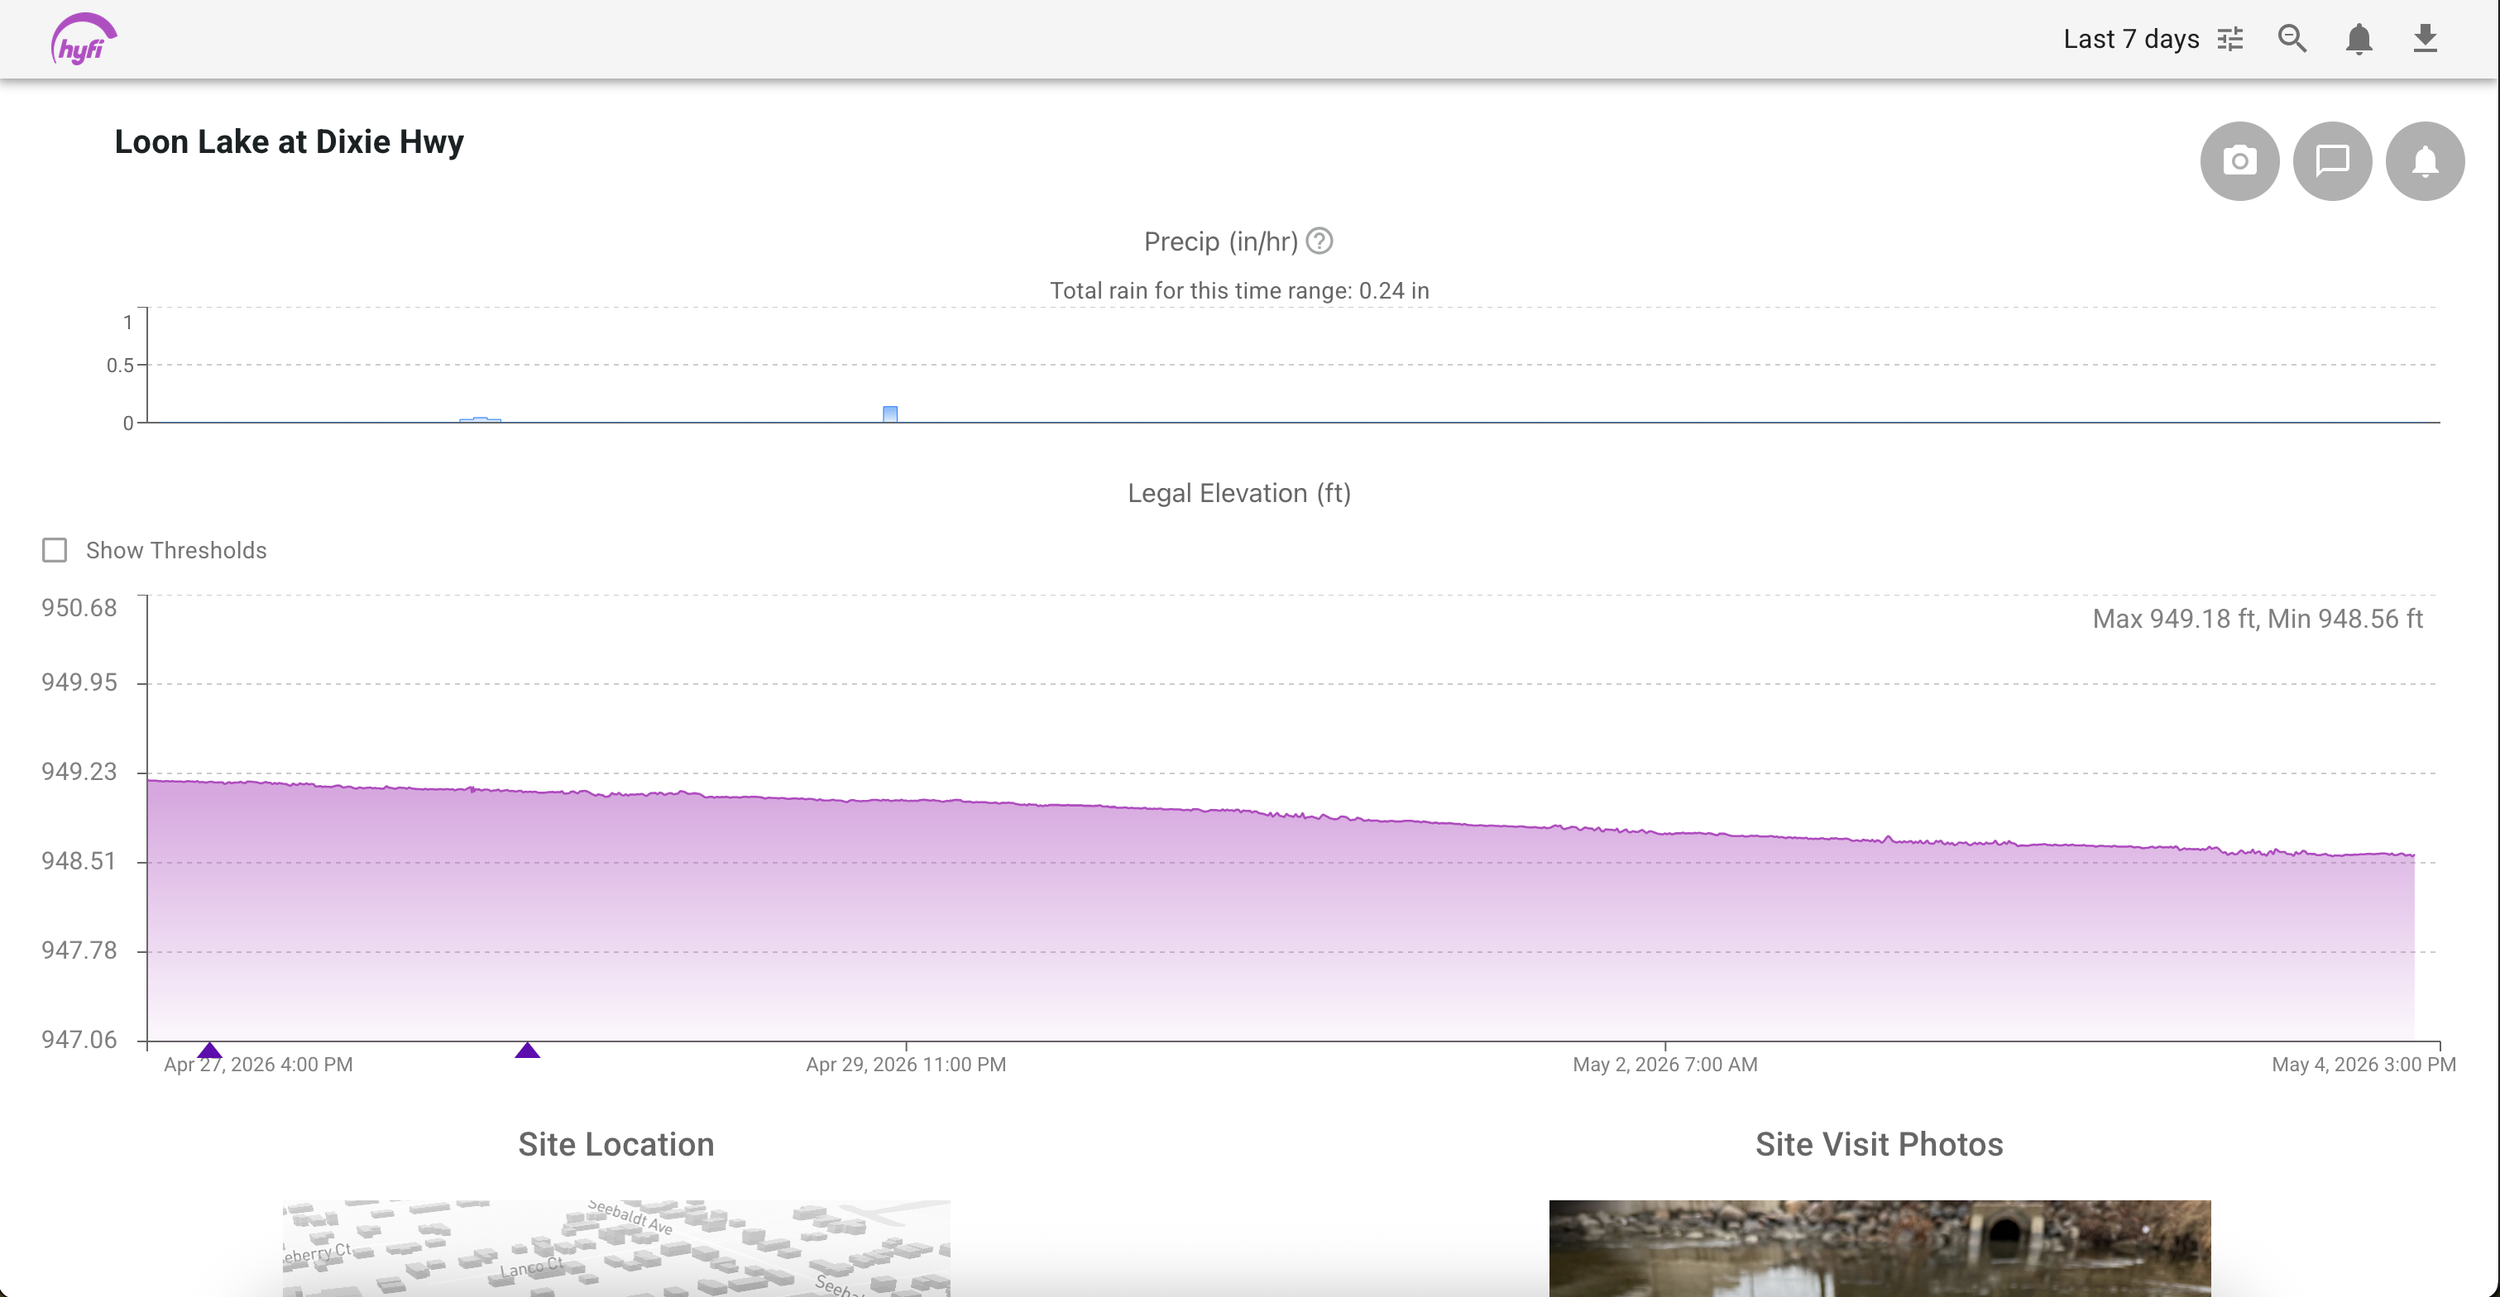
Clicking on the data preview will take you to the Hyfi page for that site. You can click on the Hyfi logo in the top left corner to return to the weather map.
Need Help?
If you're having trouble accessing the Hyfi Weather Map, or if you have any questions, contact support@hyfi.io.